Neural Meta Tracts, brain, white matter, Pietro Gori

The brain: seeing between the fibers of white matter

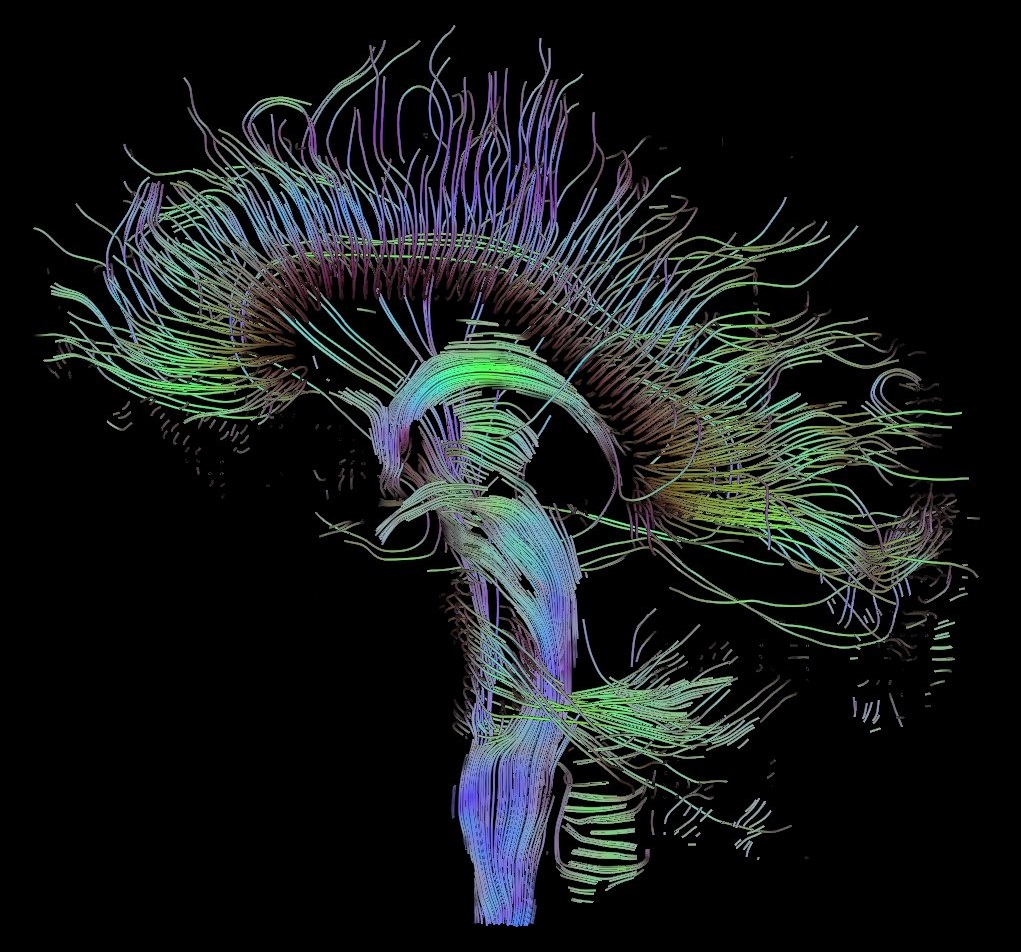
The principle behind diffusion imaging and tractography is exploring how water spreads through our brain in order to study the structure of neurons. Doctors can use this method to improve their understanding of brain disease. Pietro Gori, a researcher in image processing at Télécom ParisTech, has just launched a project called Neural Meta Tracts, funded by the Emergence program at DigiCosme. It aims to improve modelling, visualization and manipulation of the large amounts of data produced by tractography. This may considerably improve the analysis of white matter in the brain, and in doing so, allow doctors to more easily pinpoint the morphological differences between healthy and sick patients.


What is the goal of the Neural Meta Tracts project?

Pietro Gori: The project stems from my past experience. I have worked in diffusion imaging, which is a non-invasive form of brain imaging, and tractography. This technique allows you to explore the architecture of the brain’s white matter, which is made up of bundles of several millions of neuron axons. Tractography allows us to represent these bundles in the form of curves in a 3D model of the brain. It is a very rich method which provides a great deal of information, but this information is difficult to visualize and make use of in digital calculations. Our goal with Neural Meta Tracts is to facilitate and accelerate the manipulation of these data.

Who can benefit from this type of improvement to tractography?  

PG: By making visualization easier, we are helping clinicians to interpret imaging results. This may help them to diagnose brain diseases more easily. Neurosurgeons can also gain from tractography in planning operations. If they are removing a tumor, they want to be sure that they do not cut fibers in the critical areas of the brain. The more precise the image is, the better prepared they can be. As for improvements to data manipulation and calculation, neurologists and radiologists doing research on the brain are highly interested. As they are dealing with large amounts of data, it can take time to compare sets of tractographies, for example when studying the impact of a particular structure on a particular disease.

Could this help us to understand certain diseases?

PG: Yes. In psychiatry and neurology, medical researchers want to compare healthy people with sick people. This enables them to study differences which may either be the consequence or the cause of the disease. In the case of Alzheimer’s, certain parts of the brain are atrophied. Improving mathematical modeling and visualization of tractography data can therefore help medical researchers to detect these anatomical changes in the brain. During my thesis, I also worked on Tourette syndrome. Through my work, we were able to highlight anatomical differences between healthy and sick subjects.

How do you improve the visualization and manipulation of tractography data?

PG: I am working with Jean-Marc Thiery and other lecturers and researchers at Télécom ParisTech and the École Polytechnique on applying differential geometry techniques. We analyze the geometry of bundles of neuron axons, and we try to approximate them as closely as possible without losing information. We are working on algorithms which will be able to rapidly compare two sets of tractography data. When we have similar sets of data, we try to aggregate them, again trying not to lose information. It is important to realize that if you have a database of a cohort of one thousand patients, it can take days of calculation using very powerful computers to compare their tractographies in order to find averages or main variations.

Who are you collaborating with on this project to obtain the tractography data and study the needs of practitioners?

PG: We use a high-quality freely-accessible database of healthy individuals, called the Human Connectome Project. We also collaborate with clinicians in the Pitié Salpêtrière, Sainte-Anne and Kremlin-Bicêtre hospitals in the Paris region. These are radiologists, neurologists and neurosurgeons. They provide their experience of the issues with which they are faced. We are initially focusing on three applications: Tourette syndrome, multiple sclerosis, and surgery on patients with tumors.

Also read on I’MTech:

[one_half]

[/one_half]

[one_half_last]

[/one_half_last]

appli sante, health apps

Will health apps soon be covered by health insurance?

Charlotte KrychowskiTélécom École de Management – Institut Mines-Télécom ;
Meyer HaggègeGrenoble École de Management (GEM) and Myriam Le Goff-PronostIMT Atlantique – Institut Mines-Télécom

[divider style=”normal” top=”20″ bottom=”20″]

[dropcap]“A[/dropcap]pproval”. It has now been a year since the French National Authority for Health (HAS) reached a positive conclusion on whether the Diabeo application could be reimbursed by national health insurance. The application is designed to help diabetic patients in dosage and ongoing treatment. This is a first for mobile applications!

The actual ruling of whether the application can be reimbursed, however, depends on the publication of results of a medical and economic study being carried out on the tool. The Telesage study, launched in 2015, includes 700 diabetic patients in France and should indicate the effectiveness of the measure.

Over recent years, there has been a worldwide explosion of mobile applications dedicated to health. Research 2 Guidance, a company specializing in analyzing this market, estimates their number at 259,000 in 2016, compared with 100,000 a year earlier.

Apps for physical exercise, counting calories and making doctor’s appointments

They have many different uses: coaching to encourage physical exercise or healthy eating, calorie counting, making doctor’s appointments, monitoring performance in sports, offering diagnoses, monitoring chronic diseases such as diabetes and soon, cancer with Moovcare, an application designed to detect relapses after a lung tumor. Of course, not all these applications carry the possibility of being reimbursed by Social Security Services. At this point, those recognized by health authorities as medical devices, are rare. These are applications that have received a CE marking, issued by ANSM (Agence Nationale de Sécurité du Médicament et des produits de santé). Their use is reserved for diagnostic or therapeutic means. For such applications the technical requirements are higher, as the health of patients is at stake. For example, an application that allows users to take a photo of a mole so that they can evaluate the risk of a melanoma (skin cancer) has not been considered a medical device, as the editor didn’t commit any validity to the result and explained that the application was solely educational.

health apps

Sports performance monitoring applications are very popular amongst jogging fans. Shutterstock


Diabéo, an app used by both patients and nurses

Diabeo is an application monitoring diabetes, labelled a class IIb medical device, and available only by prescription. It was developed by French company Voluntis, in collaboration with the Center for Study and Research into Improving Treatment of Diabetes (CERITD) and a French pharmaceutical lab, Sanofi-Aventis. It provides patients with a “connected” record of their blood sugar levels (glycaemia). The application is coupled with a patch which is to be stuck to the arm, and a small device, a blood sugar level reader. It is used by both the patient and the nursing team. Diabeo allows the patient to adjust the dose of insulin they need to inject, especially at meal times, using the treatment prescribed by their doctor. The application also acts as a motivator, supplying patients with health practices to follow that will help keep their illness under control.

The nursing team, on the other hand, receives reports on the patient’s blood sugar levels in real time. Alerts are triggered when they go over certain thresholds. This system facilitates continuous monitoring of the patient, allowing them to arrange appointments if their treatment needs adjusting.

This app is particularly useful as we find ourselves in an era where the incidence of diabetes is skyrocketing, whilst the number of doctors is on the decline.

Patient empowerment

The example of Diabeo illustrates the benefits we can draw from mobile health, or “m-health”. In the first instance, this allows us to improve the effectiveness of treatment through a personalized monitoring system and increased involvement of the patient in their own treatment, something we call “patient empowerment”. M-health also improves the patient’s quality of life as well as that of those around them.

Mobile health can also facilitate the transfer of information to a medical organization, allowing health professionals to concentrate on their core activity: providing healthcare. Continuously monitoring the patient ultimately reduces the risk of hospitalization, and should it occur, the average length of their stay. This could have a significant impact on public spending, especially as hospitals are being pushed to tighten the belt.

With treatments getting better and the average lifespan getting longer, chronic illnesses now form a growing part, and now even the majority, of our spending on healthcare. This means that it is necessary that public healthcare changes its mentality o purely providing healthcare to focusing on prevention and coordination of care.

Mobile health solutions may ease this transition. For example, Belgium released €3.5 million at the start of 2017 for a six-month experiment in reimbursing 24 health apps and mobile devices that allow users to monitor or treat patients from a distance. The Belgian government’s objective is to learn from these pilot projects before extending the reimbursement program in 2018.

The Medical Board gives its position

Until now, France has been falling behind in the use of digital health technology or “e-health”, but it now seems ready for a fresh approach. The country is taking on board the advice given by HAS on Diabeo, as well as the report to the National Assembly in January, stating that Social Security will partially cover the cost of connected objects for high-risk populations. Along the same lines, the French National Medical Board (CNOM) has stated it is in favor of national health insurance coverage, provided that the evaluation of the applications and connected objects shows benefits for health.

Nevertheless, several conditions are necessary for mobile applications to be able to generate the expected health benefits. In terms of the State, an absolute prerequisite is the regulation of health-related data, to guarantee confidentiality.

Additionally, health authorities must endeavor to evaluate the connected medical devices faster. In total, it has been ten years since Diabeo was developed (clinical tests started in 2007) and the positive response on its reimbursement was issued by the National Authority for Health (HAS). The current time taken for evaluations to be completed are out of sync with the rapid rate at which digital technology is progressing. This is an issue that is also being faced by the American equivalent of HAS, the Food and Drug Administration (FDA).


health apps

The application Diabeo is aimed at people suffering from diabetes, but also at doctors, who can receive blood sugar level reports from their patients in real time. Shutterstock

Introducing digital technology when training doctors

We must also amend the payment system for health professionals. Fee-for-service, as is practiced today, forms part of a treatment-based mentality, and does not encourage investment in prevention.

Using health apps requires us to reorganize training systems, for example by introducing teaching on digital technology in medicine studies and by creating training courses for future professions that may emerge in digital healthcare. For example, in the case of Diabeo, there will be a need to train nurses in distance monitoring of diabetes.

In terms of businesses, first and foremost, structuring of the sector must continue. France is a dynamic breeding ground for start-ups in the e-health sector, which will surely mean that better coordination will be required. The creation of structures such as the e-Health France Alliance or France eHealthTech is a first step towards allowing French businesses to gain visibility abroad and establishing a dialogue with public authorities in France.

Linking start-ups with pharmaceutical labs

Fundamentally speaking, beyond technological innovation, these companies must also innovate according to their economic models. This may occur through the alliance with major pharmaceutical labs that are searching for new paths for growth. This is the strategy that Voluntis successfully followed not only when they collaborated closely with Sanofi to produce Diabeo, but also in other therapeutic sectors, collaborating with Roche and AstraZeneca.

New economic models may call for private funding, for example from health insurance companies. These models may implement variable reimbursement rates, depending on results obtained by the app designers for a target population on predefined criteria, for example, a lower rate of hospitalization or better health stability in patients.

It seems likely that the State, by expanding the legislative framework and rethinking traditional economic models, will benefit from the potential offered by these technological advances, as will the public.

[divider style=”dotted” top=”20″ bottom=”20″]

Charlotte Krychowski, Lecturer in strategic management, Télécom École de Management – Institut Mines-Télécom Meyer Haggège, Post-Doctorate Researcher in strategic management and innovation, Grenoble École de Management (GEM) and Myriam Le Goff-Pronost, Associate Professor, IMT Atlantique – Institut Mines-Télécom

The original version of this article was published in French on The Conversation.


Auragen

The Auragen project: turning the hopes of genomic medicine into reality

There is only one way to unlock the mysteries of certain genetic diseases — analyze each patient gene by gene. Genome analysis offers great promise for understanding rare diseases and providing personalized treatment for each patient. The French government hopes to make this new form of medicine available through its healthcare system by 2025. To achieve this aim, institutional healthcare stakeholders have joined forces to develop gene sequencing platforms. One such platform, named Auragen, will be established in the Auvergne Rhône-Alpes region. Mines Saint-Étienne is one of the partners in the project. Vincent Augusto, an industrial engineering researcher at the Saint-Etienne school, explains Auragen’s objectives and how he is involved in creating the platform.  


What is the purpose of genomic medicine?

Vincent Augusto: Certain diseases are caused by modifications of the genetic code, which are still not understood. This is true for many forms of cancer or other rare pathologies. In order to treat patients with these diseases, we must understand genetic alterations and be able to determine how these genes are different from those of a healthy individual. The goal of genomics is therefore to sequence a patient’s genome, the entire set of genes, in order to understand his disease and provide personalized diagnosis and treatment.


Is genomic medicine a recent idea?

VA: Gene sequencing has existed for 40 years, but it was very costly and could take up to several months to determine the entire genome of a living being. Thanks to advances in technology, a human being’s genome can now be sequenced in just a few hours. The main limitation to developing genomic medicine is an economic one, some startups offer sequencing for several thousand euros. But in order to make this service available to patients through the healthcare system, the processes must be industrialized in order to bring down the cost. And this is precisely what the Auragen project aims to do.


What is the Auragen project?

VA: It is part of the France Genomic Medicine 2025 Plan launched in 2016 with the aim of developing genomics in the French healthcare system. The Auragen project strives to create one of the two sequencing platforms in France in the Auvergne Rhône-Alpes region (the other platform, SeqOIA is located in the Ile-de-France region). To do so, it has brought together the University Hospital Centers of Lyon, Lyon, Grenoble, Saint-Étienne and Clermont-Ferrand, two cancer centers and research centers including Mines Saint-Étienne. The goal is to create a platform that provides the most efficient way to sequence and centralize samples and send them to doctors, as quickly and inexpensively as possible.


How are you contributing to the project?

VA: At Mines Saint-Étienne, we are involved in the organizational assessment of the platform. Our role is to model platform components and the players who will be involved to optimize the analysis of sequences and the speed with which samples are transmitted. To do so, we use mathematical healthcare models to find the best possible way to organize the process, from a patient’s consultation with an oncologist to the result. This assessment is not only economic in nature. We also aim to quantitatively asses the platform’s benefits for patients. The assessment tools will be designed to be reproduced and used in other gene sequencing platforms initiatives.


What research are you drawing on to assess the organization of the Auragen platform?

VA: We are drawing on the e-SIS project we took part in, in which we evaluated the impact of information and communication technologies in oncology. This project was part of a research program to study the performance of the Ministry of Health’s healthcare system. We proposed methods for modeling different processes, computerized and non-computerized, in order to compare the effectiveness of both systems. This allowed us to quantitatively evaluate the benefits of computer systems in oncologists’ offices.


What challenges do you face in assessing a sequencing platform?

VA: The first challenge is to try to size and model a form of care which doesn’t exist yet. We’ll need to have discussions with oncologists and genomics researchers to determine at what point in the treatment pathway sequencing technologies should be integrated. Then comes the question of the assessment itself. We have a general idea about the cost of sequencing devices and operations, but these methods will also lead to new treatment approaches whose costs will have to be calculated. And finally, we’ll need to think about how to optimize everything surrounding the sequencing itself. The different computational biology activities for analyzing data and the transmission channels for the samples must not be slowed down.


What is the timeline for the Auragen project?

VA: Our team will be involved in the first three years of the project in order to carry out our assessment. The project will last a total of 60 months. At the end of this period, we should have a working platform which is open to everyone and whose value has been determined and quantified. But before that, the first deadline is in 2019, at which time we must already be able to maintain a pace of 18,000 samples sequenced per year.


Fine particles are dangerous, and not just during pollution peaks

Véronique Riffault, IMT Lille Douai – Institut Mines-Télécom and François Mathé, IMT Lille Douai – Institut Mines-Télécom

[divider style=”normal” top=”20″ bottom=”20″]

[dropcap]T[/dropcap]he French Agency for Food, Environmental and Occupational Health and Safety (ANSES) released a new notice concerning air pollution yesterday. After having been questioned on the potential changes to norms for ambient air quality, particularly concerning fine particles (PM10 and PM2.5), the organization has highlighted the importance of pursuing work on implementing long-term public policies that promote the improvement of air quality. They recommend lowering the annual threshold value for PM2.5 to equal the recommendations made by the WHO, and introducing a daily threshold value for this pollutant. As the following data visualization shows, the problem extends throughout Europe.

Average concentrations of particulate matters whose aerodynamic diameter is below 2.5 micrometers (called “PM2.5” which makes up “fine particles” along with PM10) for the year 2012. Amounts calculated using measures from fixed air quality monitoring stations, shown in micrograms per m3 of air. Data source: AirBase.

The level reached in peak periods is indicated by hovering the mouse over a given circle, the sizes of which will vary depending on the amount. The annual average is also provided, detailing long-term exposure and the subsequent proven impact on health (particularly on the respiratory and cardio-vascular systems). It should be noted that the annual target value for the particles (PM2.5), as specified by European legislation is currently 25 µg/m3. The level will drop to 20 µg/m3 in 2020, whilst the WHO currently recommends an annual threshold of 10 µg/m3.

The data shown on this map correspond exclusively to a so-called “fundamental” site typology, examining not only urban environments but also rural ones, which are far from being influenced by nearby pollution (coming from traffic or industry). Airbase also collects data supplied by member states that use measuring methods that can vary depending on the site but always respect the data quality objectives and are specific to the pollutant (90% of data on PM2.5 is approved annually, with an uncertainty of ± 25%). This perhaps explains why certain regions show little or no data (Belarus, Ukraine, Bosnia-Herzegovina and Greece), keeping in mind that a single station cannot be representative of the air quality across an entire country (as is the case in Macedonia).

The PM2.5 shown here may be emitted directly into the atmosphere (these are primary particles) or formed by chemical reactions between gaseous pollutants in the atmosphere (secondary particles). The secondary formation of PM2.5 often stems from peaks in pollution at certain points in the year when the sources of the pollutants are most significant and in meteorological conditions which allow them to accumulate. Sources connected to human activity are mainly linked to combustion processes (such as engines in vehicles or the burning of biomass and coal for residential heating systems) and agricultural activity.

The above map shows that the threshold suggested by the WHO has been surpassed in a large majority of stations, particularly in Central Europe (Slovakia, South Poland) due to central heating methods, or in Northern Italy (the Po Valley), which has been affected by poor topographical and meteorological conditions.

Currently, only 1.16% of stations are recording measurements that are still within the WHO recommendations for PM2.5 (shown in light green on the map). On top of this, 13.6% of stations have already reached the future European limits to be set in 2020 (shown in green and orange circles).

This illustrates that a large section of the European population is being exposed to concentrations of particles that are harmful to health and that some significant efforts are to be made. In addition, when considering that the mass concentration of particulates is a good indicator of air quality, their chemical composition should not be forgotten. This is something which proves to be a challenge for health specialists and policymakers, especially in real time.

Véronique Riffault, Professor in Atmospheric Sciences, IMT Lille Douai – Institut Mines-Télécom and François Mathé, Professor-Researcher, President of the AFNOR X43D Normalization Commission “Ambient Atmospheres”, Head of Studies at LCSQA (Laboratoire Central de Surveillance de la Qualité de l’Air), IMT Lille Douai – Institut Mines-Télécom


The original version  of this article was published in French in The Conversation France.


Fine particulate pollution: can we trust microsensor readings?

Nathalie RedonIMT Lille Douai – Institut Mines-Télécom

Last May, Paris City Hall launched “Pollutrack”: a fleet of micro sensors placed on the roofs of vehicles traveling throughout the capital to measure the amount of fine particles present in the air in real-time. A year before, Rennes proposed that residents participate in assessing the air quality via individual sensors.

In France, for several years, high concentrations of fine particles have been regularly observed, and air pollution has become a major health concern. Each year in France, 48,000 premature deaths are linked to air pollution.

The winter of 2017 was a prime example of this phenomenon, with daily levels reaching up to 100µg/m3 in certain areas, and with conditions stagnating for several days due to the cold and anticyclonic weather patterns.


A police sketch of the fine particle

A fine particle (particulate matter, abbreviated PM) is characterized by three main factors: its size, nature and concentration.

Its size, or rather its diameter, is one of the factors that affects our health: the PM10 have a diameter ranging from 2.5 to 10μm; PM2.5, a diameter less than 2.5μm. By way of comparison, one particle is approximately 10 to 100 times finer than a hair. And this is the problem: the smaller the particles we inhale, the more deeply they penetrate the lungs, leading to an inflammation of the lung alveoli, as well as the cardiovascular system.

The nature of these fine particles is also problematic. They are made up of a mixture of organic and mineral substances with varying degrees of danger: water and carbon form the base around which condense sulfates, nitrates, allergens, heavy metals and other hydrocarbons with proven carcinogenic properties.

As for their concentration, the greater it is in terms of mass, the greater the health risk. The World Health Organization recommends not to exceed personal exposure of 25 μg/m3 for the PM2.5 as a 24-hour average and 50 μg/m3 for the PM10. In recent years, thresholds have been constantly exceeded, especially large cities.


particules fines

The website for the BreatheLife campaign, created by WHO, where you can enter the name of a city and find out its air quality. Here, the example of Grenoble is given.


Humans are not the only ones affected by the danger of these fine particles: when they are deposited, they contribute to the enrichment of natural environments, which can also lead to an eutrophication, phenomena, meaning excess amounts of nutriments, such as the nitrogen carried by the particles, are deposited in the soil or water. For example, this leads to algal blooms that can suffocate local ecosystems. In addition, due to the chemical reaction of the nitrogen with the surrounding environment, the eutrophication generally leads to soil acidification. Soil that is more acidic becomes drastically less fertile: vegetation becomes depleted, and slowly but inexorably, species die off.


Where do they come from?

Fine particle emissions primarily originate from human activities: 60% of PM10 and 40% of PM2.5 are generated from wood combustion, especially from fireplace or stove heating, 20% to 30% originate from automotive fuel (diesel is the number one). Finally, nearly 19% of national PM10 emissions, and 10% PM2.5 emissions result from agricultural activities.

To help public authorities limit and control these emissions, the scientific community must improve the identification and quantification of these sources of emissions, and must gain a better understanding of their spatial and temporal variability.


Complex and costly readings

Today, fine particle readings are primarily based on two techniques.

First, samples are taken from filters; these are taken after an entire day and are then analyzed in a laboratory. Aside from the fact that the data is delayed, the analytical equipment used is costly and complicated to use; a certain level of expertise is required to interpret the results.

The other technique involves making measurements in real time, using tools like the Multi-wavelength Aethalometer AE33, a device that is relatively expensive, at over €30,000, but has the advantage of providing measurements every minute or even under a minute. It is also able to monitor black carbon (BC): it can identify the particles that originate specifically from combustion reactions. The aerosol chemical speciation monitor (ACSM) is also worth mentioning, as it makes it possible to identify the nature of the particles, and takes measurements every 30 minutes. However, its cost of €150,000 means that access to this type of tool is limited to laboratory experts.

Given their cost and level of sophistication, there are a limited number of sites in France that are equipped with these tools. Thanks to these simulations, the analysis of daily averages makes it possible to create maps with a 50km by 50km grid.

Since these means of measurement do not make it possible to establish a real-time map with finer spatio-temporal scales—in terms of the km2 and minutes—the scientists have recently begun looking to new tools: particle microsensors.


How do microsensors work?

Small, light, portable, inexpensive, easy to use, connected… microsensors appear to offer many advantages that complement the range of heavy analytical techniques mentioned above.

But how credible are these new devices? To answer this question, we need to look at their physical and metrological characteristics.

At present, several manufactures are competing for the microsensor market: the British Alphasense, the Chinese Shinyei and the American manufacturer, Honeywell. They all use the same measurement method: optical detection using a laser diode.

The principle is simple: the air, sucked in by the fan, flows through the detection chamber, which is configurated to remove the larger particles, and retain only the fine particles. The air, loaded with particles, flows through the optical signal emitted by the laser diode, the beam of which is diffracted by a lens.

A photodetector placed opposite the emitted beam records decreases in luminosity caused by the passing particles, and counts the number by size ranges. The electrical signal from the photodiode is then transmitted to a microcontroller that processes the data in real time: if the air flow rate is known, the concentration number can then be determined, and then the mass, based on the size ranges, as seen in the figure below.


An example of a particle sensor (brand: Honeywell, HPM series)


From the most basic to the fully integrated version (including acquisition and data processing software, and measurement transmission via cloud computing), the price can range from €20 to €1,000 for the most elaborate systems. This is very affordable, compared to the techniques mentioned above.


Can we trust microsensors?

First, it should be noted that these microsensors do not provide any information on the fine particles’ chemical composition. Only the techniques described above can do that. However, knowledge of the particles’ nature provides information about their source.

Furthermore, the microsensor system used to separate particles by size is often rudimentary; field tests have shown that while the finest particles (PM2.5) are monitored fairly well, it is often difficult to extract the PM10 fraction alone. However, the finest particles are precisely what affect our health the most, so this shortcoming is not problematic.

In terms of the detection/quantification limits, when the sensors are new, it is possible to reach reasonable thresholds of approximately 10µg/m3. They also have sensitivity levels between 2 and 3µg/m3 (with an uncertainty of approximately 25%), which is more than sufficient for monitoring the dynamics of how the particle concentrations change in the concentration range of up to 200µg/m3.

However, over time, the fluidics and optical detectors of these systems tend to become clogged, leading to errors in the results. Microsensors must therefore be regularly calibrated by connecting them to reference data, such as the data released by air pollution control agencies.

This type of tool is therefore ideally suited for an instantaneous and semi-quantitative diagnosis. The idea is not to provide an extremely precise measurement, but rather to report on the dynamic changes in particulate air pollution on a scale with low/medium/high levels. Due to the low cost of these tools, they can be distributed in large numbers in the field, and therefore help provide a better understanding of particulate matter emissions.


Nathalie Redon, Assistant Professor, Co-Director of the “Sensors” Laboratory, IMT Lille Douai – Institut Mines-Télécom

This article was originally published in French on The Conversation.


qualité de l'air, modélisation, air quality, modeling

Air quality: several approaches to modeling the invisible

The theme day on air quality modeling (organized by FIMEA and IMT Lille Douai) on June 8 provided an opportunity for researchers in this field to exchange on existing methods. Modeling makes it possible to identify the link between pollution sources and receptors. These models help provide an understanding of atmospheric processes and air pollution prevention.


What will the pollution be like tomorrow? Only one tool can provide answer: modeling. But what is modeling? It all depends the area of expertise. In the field of air quality, this method involves creating computer simulations to represent different scenarios. For example, it enables pollutant emissions to be simulated before building a new highway. Just as meteorological models predict rain, an air quality model predicts pollutant concentrations. Modeling also provides a better understanding of the physical and chemical reactions that take place in the atmosphere. “There are models that cover smaller and larger areas, which make it possible to study the air quality for a continent, region, or even for one street,” explains Stéphane Sauvage, a researcher with the Atmospheric Sciences and Environmental Engineering Department (SAGE) at IMT Lille-Douai. How are these models developed?


Models, going back to the source

The first approach involves identifying the sources that emit the pollutants via field observations, an area of expertise at IMT Lille-Douai. Sensors located near the receptors (individuals, ecosystems) measure the compounds in the form of gas or particles (aerosols). The researchers refer to certain types that are detected as tracers, because they are representative of a known source of emissions. “Several VOC (Volatile Organic Compounds) are emitted by plants, whereas other kinds are typical of road traffic. We can also identify an aerosol’s origin (natural, wood combustion…) by analyzing its chemical composition,” Stéphane Sauvage explains.

The researchers study the hourly, daily, and seasonal variability of the tracers through statistical analysis. These variations are combined with models that trace the path air masses followed before reaching the observation site. “Through this temporal and spatial approach, we can succeed in reproducing the potential areas of origin. We observe ‘primary’ pollutants, which are directly emitted by the sources, and are measured by the receptors. But secondary pollutants also exist; the result of chemical reactions that take place in the atmosphere,” the researcher adds. To identify the sources of this second category of pollutants, researchers identify the reactions that could possibly take place between chemical components. This is a complex process, since the atmosphere is truly a reactor, within which different species are constantly being transformed. Therefore, the researchers come up with hypotheses to enable them to find the sources. Once these models are functional, they are used as decision-making tools.


Models focused on receptors

A second approach, referred to as the “deterministic” modeling, is focused on the receptors. Based on what they know about the sources (concentrations of industrial waste and of road traffic…), the researchers use air mass diffusion and movement models to visualize the impact these emissions have on the receptor. To accomplish this, the models integrate meteorological data (wind, temperature, pressure…) and the equations of the chemical reactions taking place in the atmosphere. These complex tools require a comprehensive knowledge of atmospheric processes and high levels of computing power.

These models are used for forecasting purposes. “air pollution control agencies use them to inform the public of the levels of pollutants in a given area. If necessary, the prefecture can impose driving restrictions based on the forecasts these models provide,” explains Stéphane Sauvage. This modeling approach also makes it possible to simulate environmental impact assessments for industrial sites.


Complementary methods

Both methods have their have limits and involve uncertainties. The models based on observations are not comprehensive. “We do not know how to observe all the species. In addition, this statistical approach requires a large amount of observations to be made before a reliable and robust model can be developed. The hypotheses used in this approach are simplistic compared to the receptor-focused models,” Stéphane Sauvage adds. The other type of model also relies on estimations. It uses data that can be uncertain, such as the estimation of the sources’ emissions and the weather forecasts.

We can combine these two methods to obtain tools that are more effective. The observation-based approaches make it possible to assess information about the sources, which is useful for the deterministic models. The deterministic models are validated by comparing the predictions with the observations. But we can also integrate the observed data into the models to correct them,” the researcher adds. This combination limits the uncertainties involved and supports the identification of links between the sources and receptors. The long-term objective is to propose decision-making tools for policies aimed at effectively reducing pollutants.


electromagnetic waves

Our exposure to electromagnetic waves: beware of popular belief

Joe Wiart, Télécom ParisTech – Institut Mines-Télécom, Université Paris-SaclayJoe Wiart, Exposition ondes électromagnétiques

This article is published in partnership with “La Tête au carré”, the daily radio show on France Inter dedicated to the popularization of science, presented and produced by Mathieu Vidard. The author of this text, Joe Wiart, discussed his research on the show broadcast on April 28, 2017 accompanied by Aline Richard, Science and Technology Editor for The Conversation France.


For over ten years, controlling exposure to electromagnetic waves and to radio frequencies in particular has fueled many debates, which have often been quite heated. An analysis of reports and scientific publications devoted to this topic shows that researchers are mainly studying the possible impact of mobile phones on our health. At the same time, according to what has been published in the media, the public is mainly concerned about base stations. Nevertheless, mobile phones and wireless communication systems in general are widely used and have dramatically changed how people around the world communicate and work.

Globally, the number of mobile phone users now exceeds 5 billion. And according to the findings of an Insee study, the percentage of individuals aged 18-25 in France who own a mobile phone is 100%! It must be noted that the use of this method of communication is far from being limited to simple phone calls — by 2020 global mobile data traffic is expected to represent four times the overall internet traffic of 2005.  In France, according to the French regulatory authority for electronic and postal communications (ARCEP), over 7% of the population connected to the internet exclusively via smartphones in 2016. And the skyrocketing use of connected devices will undoubtedly accentuate this trend.


electromagnetic waves

Smartphone Zombies. Ccmsharma2/Wikimedia


The differences in perceptions of the risks associated with mobile phones and base stations can be explained in part by the fact that the two are not seen as being related. Moreover, while exposure to electromagnetic waves is considered to be “voluntary” for mobile phones, individuals are often said to be “subjected” to waves emitted by base stations. This helps explains why, despite the widespread use of mobiles and connected devices, the deployment of base stations remains a hotly debated issue, often focusing on health impacts.

In practice, national standards for limiting exposure to electromagnetic waves are based on the recommendations of the International Commission on Non-Ionizing Radiation Protection (ICNIRP) and on scientific expertise. A number of studies have been carried out on the potential effects of electromagnetic waves on our health. Of course, research is still being conducted in order to keep pace with the constant advancements in wireless technology and its many uses. This research is even more important since radio frequencies from mobile telephones have now been classified as “possibly carcinogenic for humans” (group 2B) following a review conducted by the International Agency for Research on Cancer.

Given the great and ever-growing number of young people who use smartphones and other mobile devices, this heightened vigilance is essential. In France the National Environmental and Occupational Health Research Programme (PNREST) of the National Agency for Food, Environmental and Occupational Health Safety (Anses) is responsible for monitoring the situation. And to address public concerns about base stations (of which there are 50,000 located throughout France), many municipalities have discussed charters to regulate where they may be located. Cities such as Paris, which, striving to set an example for France and major European cities, signed such a charter as of 2003, are officially limiting exposure from base stations through a signed agreement with France’s three major operators.

Exposition ondes électromagnétiques, Joe Wiart

Hillside in Miramont, Hautes Pyrenees France. Florent Pécassou/Wikimedia

This charter was updated in 2012 and was further discussed at the Paris Council in March, in keeping with the Abeille law, which was proposed to the National Assembly in 2013 and passed in February 2015, focusing on limiting the exposure to electromagnetic fields. Yet it is important to note that this initiative, like so many others, concerns only base stations despite the fact that exposure to electromagnetic waves and radio frequencies comes from many other sources. By focusing exclusively on these base stations, the problem is only partially resolved. Exposure from mobile phones for users or their neighbors must also be taken into consideration, along with other sources.

In practice, the portion of exposure to electromagnetic waves which is linked to base stations is far from representing the majority of overall exposure. As many studies have demonstrated, exposure from mobile phones is much more significant.  Fortunately, the deployment of 4G, followed by 5G, will not only improve speed but will also contribute to significantly reducing the power radiated by mobile phones. Small cell network architecture with small antennas supplementing larger ones will also help limit radiated power.  It is important to study solutions resulting in lower exposure to radio frequencies at different levels, from radio devices to network architecture or management and provision of services. This is precisely what the partners in the LEXNET European project set about doing in 2012, with the goal of cutting public exposure to electromagnetic fields and radio frequency in half.

In the near future, fifth-generation networks will use several frequency bands and various architectures in a dynamic fashion, enabling them to handle both increased speed and the proliferation of connected devices. There will be no choice but to effectively consider the network-terminal relationship as a duo, rather than treating the two as separate elements. This new paradigm has become a key priority for researchers, industry players and public authorities alike. And from this perspective, the latest discussions about the location of base stations and renewing the Paris charter prove to be emblematic.


Joe Wiart, Chairholder in research on Modeling, Characterization and Control of Exposition to Electromagnetic Waves at Institut Mines Telecom, Télécom ParisTech – Institut Mines-Télécom, Université Paris-Saclay

This article was originally published in French in The Conversation France The Conversation

Honoris Causa

IMT awards the title of Doctor Honoris Causa to Jay Humphrey, Professor at Yale University

This prestigious honor was awarded on 29 June at Mines Saint-Etienne by Philippe Jamet, President of IMT, in the presence of many important scientific, academic and institutional figures. IMT’s aim was to honor one of the inventors and pioneers of a new field of science – mechanobiology – which studies the effects of mechanical stress (stretches, compressions, shearing, etc.) on cells and living tissue.


A world specialist in cardiovascular biomechanics, Jay D. Humphrey has worked tirelessly throughout his career to galvanize the biomechanical engineering community and draw attention to the benefits that this science can offer to improve medicine.

Jay D. Humphrey works closely with the Engineering & Health Center (CIS) of Mines Saint-Etienne. In 2014, he invited Stéphane Avril, Director of the CIS, to Yale University to work on biomechanics applied to soft tissues and the prevention of ruptured aneurysms, which notably led to the award of two grants from the prestigious European Research Council:

 Biomechanics serving Healthcare

For Christian Roux, Executive Vice President for Research and Innovation at IMT, “With this award the institute wanted to recognize this important scientist, known throughout the world for the quality of his work, his commitment to the scientific community and his strong human and ethical values. Professor Humphrey also leads an exemplary partnership with one of IMT’s most cutting-edge laboratories, offering very significant development opportunities.

[author title=”biography of Jay D. Humphrey” image=”https://imtech-test.imt.fr/wp-content/uploads/2017/07/PortraitJHumphrey.jpg”]

Jay Humphrey is Professor and Chair of the Biomedical Engineering Department of the prestigious Yale University in the United States. He holds a PhD in mechanical engineering from the Georgia Institute of Technology (Atlanta, United States) and a post-doctorate in cardiovascular medicine from John Hopkins University (Baltimore, United States).

He chaired the scientific committee of the World Congress of Biomechanics in 2014, held in Boston and attended by more than 4,000 people.

He co-founded the Biomechanics and modeling in mechanobiology journal in 2002, which today plays a leading role in the field of biomechanics.

Jay D. Humphrey has written a large number of papers (245+) which have been universally praised and cited countless times (25,000+). His works are considered essential references and engineering students throughout the world rely on his introductions to biomechanics and works on cardiovascular biomechanics.

He is heavily involved in the training and support for students – from Master’s degrees to PhDs – and more than a hundred students previously under his supervision now hold posts in top American universities and major international businesses, such as Medtronic.

Jay D. Humphrey has already received a number of prestigious awards. He plays an influential role in numerous learned societies, and in the assessment committees of the National Institute of Health (NIH) in the United States.[/author]


4D Imaging, Mohamed Daoudi

4D Imaging for Evaluating Facial Paralysis Treatment

Mohamed Daoudi is a researcher at IMT Lille Douai, and is currently working on an advanced system of 4-dimensional imaging to measure the after-effects of peripheral facial paralysis. This tool could prove especially useful to practitioners in measuring the severity of the damage and in their assessment of the efficacy of treatment.


Paralysis began with my tongue, followed by my mouth, and eventually the whole side of my face”. There are many accounts of facial paralysis on forums. Whatever the origin may be, if the facial muscles are no longer responding, it is because the facial nerve stimulating them has been affected. Depending on the part of the nerve affected, the paralysis may be peripheral, in this case affecting one of the lateral parts of the face (or hemifacial), or may be central, affecting the lower part of the face.

In the case of peripheral paralysis, there are so many internet users enquiring about the origin of this problem precisely because in 80% of cases the paralysis occurs without apparent case. However, there is total recovery in more than 85 to 90% of cases. The other common causes of facial paralysis are facial trauma, and vascular or infectious causes.

During the follow-up treatment, doctors try to re-establish facial symmetry and balance in a resting position and for a facial impression. This requires treating the healthy side of the face as well as the affected side. The healthy side often presents hyperactivity, which makes it look as if the person is grimacing and creates paradoxical movements. Many medical, surgical, and physiotherapy procedures are used in the process. One of the treatments used is to inject botulinum toxin. This partially blocks certain muscles, creating balance and facial movement.

Nonetheless, there is no analysis tool that can quantify the facial damage and give an objective observation of the effects of treatment before and after injection. This is where IMT Lille Douai researcher Mohamed Daoudi[1] comes in. His specialty is 3D statistical analysis of shapes, in particular faces. He especially studies the dynamics of faces and has created an algorithm on the analysis of facial expressions making it possible to quantify deformations of a moving face.


Smile, you’re being scanned

Two years ago, a partnership was created between Mohamed Daoudi, Pierre Guerreschi, Yasmine Bennis and Véronique Martinot from the reconstructive and aesthetic plastic surgery department at the University Hospital of Lille. Together they are creating a tool which makes a 3D scan of a moving face. An experimental protocol was soon set up.[2]

The patients are asked to attend a 3D scan appointment before and after injecting botulinum toxin. Firstly, we ask them to make stereotypical facial expression, a smile, or raising their eyebrows. We then ask them to pronounce a sentence which triggers a maximum number of facial muscles and also tests their spontaneous movement”, explains Mohamed Daoudi.

The 4D results pre- and post-injection are then compared. The impact of the peripheral facial paralysis can be evaluated, but also quantified and compared. In this sense, the act of smiling is far from trivial. “When we smile, our muscles contract and the face undergoes many distortions. It is the facial expression which gives us the clearest image of the asymmetry caused by the paralysis”, the researcher specifies.

The ultimate goal is to manage to re-establish a patient’s facial symmetry when they smile. Of course, it is not a matter of symmetry, as no face is truly symmetrical. We are talking about socially accepted symmetry. The zones stimulated in a facial expression must roughly follow the same muscular animation as those in the other side of the face.

4D Imaging, Mohamed Daoudi, IMT Lille Douai

Scans of a smiling face: a) pre-operation, b) post-operation, c) control face.


Time: an essential fourth dimension in analysis

This technology is particularly well-suited to studying facial paralysis, as it takes time into account, and therefore the face’s dynamics. Dynamic analysis provides additional information. “When we look at a photo, it is sometimes impossible to detect facial paralysis. The face moves in three dimensions, and the paralysis is revealed with movement”, explains Mohamed Daoudi.

The researcher uses non-invasive technology to model the dynamics: a structured-light scanner. How does it work? A grid of light stripes is projected onto the face. This gives a face in 3D, depicted by a cloud of around 20,000 dots. Next, a sequence of images of the face making facial expressions is recorded at 15 images per second. The frames are then studied using an algorithm which calculates the deformation observed in each dot. The two sides of the face are then superimposed for comparison.


4D Imaging, Mohamed Daoudi, IMT Lille Douai

Series of facial expressions made during the scan.


Making 4D technology more readily available

Until present, this 4D imaging technique has been tested on a small number of patients between 16 and 70 years old. They have all tolerated it well. Doctors have also been satisfied with the results. They are now looking at having the technology statistically validated, in order to develop it on a larger scale. However, the equipment required is expensive. It also requires substantial human resources to acquire the images and the resulting analyses.

For Mohamed Daoudi, the project’s future lies in simplifying the technology with low-cost 3D capture systems, but other perspectives could also prove interesting. “Only one medical service in the Hauts-de-France region offers this approach, and many people come from afar to use it. In the future, we could imagine remote treatment, where all you would need is a computer and a tool like the Kinect. Another interesting market would be smartphones. Depth cameras which provide 3D images are beginning to appear on these devices, as well as tablets. Although the image quality is not yet optimal, I am sure it will improve quickly. This type of technology would be a good way of making the technology we developed more accessible”.


[1] Mohamed Daoudi is head of the 3D SAM team at the CRIStAL laboratory (UMR 9189). CRIStAL (Research center in Computer Science, Signal and Automatic Control of Lille) is a laboratory (UMR 9189) of the National Center for Scientific Research, University Lille 1 and Centrale Lille in partnership with University Lille 3, Inria and Institut Mines-Télécom (IMT).

[2] This project was supported by Fondation de l’avenir


Fine particulate matter pollution peaks, Véronique Riffautl, IMT Lille Douai

Particulate matter pollution peaks: detection and prevention

By Véronique Riffault, Professor of Atmospheric Sciences, IMT Lille Douai – Institut Mines-Télécom
This article was originally published in French in The Conversation France.

[divider style=”normal” top=”5″ bottom=”5″]


This winter, France and a large part of Europe were struck by episodes of particulate matter pollution. These microscopic particles are known as PM2.5 and PM10 when they measure less than 2.5 or 10 micrometers (µm) in diameter respectively.

They are proven to be harmful to human health because they enter our respiratory system, and the smallest can even enter our blood flow. According to the European Environment Agency, air pollution is the cause of 467,000 premature deaths annually in Europe.

These particles can come from natural sources (sea salt, volcanic eruptions, forest fires etc.) or human activities (transport, heating, industry etc.)


What is a pollution peak?

Pollution peaks occur when regulatory warning thresholds, as defined in 2008 by the European Union and transposed to French law in late 2010, are exceeded.

In virtue of these regulations, the first level of severity (known as the “public information and warning threshold”) is reached for PM10 particles when there are ≥50 µg per cubic meter of air (m³) in the atmosphere; the warning level is reached at ≥80 µg/m³.

There is no trigger limit for PM2.5, but just a set maximum amount of 25 µg/m³ on average per year.

However, these regulations have serious limitations. The “mass” concentration thresholds which indicate the total mass of particles in the air and which are used to assess the danger of particulate matter pollution are higher than the levels recommended by the WHO, which have been set for PM10 at 20 µg/m³ on average per year and 50 µg/m³ on average per day, in order to take account of chronic and short-term exposure.

In addition, the only parameter taken into account in European and French regulations concerns mass concentration. The concentration in terms of number (i.e. the number of particles per m³ of air), and the chemical composition are not taken into account for the triggering of warnings.

Lastly, there are no regulations for very small particulate matter (less than 1 µm), which is mainly produced by human activity, even though it is potentially the most harmful.


Comparison of the size of microscopic particles with a hair and grain of sand. US-EPA


How are they detected?

In France, the Ministry for the Environment has delegated the task of monitoring air quality and regulated pollutants across the country to certified associations united under Fédération Atmo France. They are supported in this task by the Central Laboratory for the Monitoring of Air Quality.

These associations put in place automatic measurements for the concentration of pollutants, as well as other monitoring measures to allow a better understanding of the phenomena observed, such as the chemical composition of particles, or weather conditions.

These measurements can be combined with approaches for modeling particle concentration, thanks in particular to Prevair, the French forecast platform. Calculating the history of air mass can also be used to reveal the origin of particles, and it is therefore now possible to describe the phenomena at the origin of the increase in concentrations in relative detail.


Explanation of a real case

The graph below, produced from observations by our research department and measurements by Atmo Hauts-de-France, illustrates an example of pollution peaks that affected the local area in January 2017.

During this period, anticyclonic weather conditions contributed to the stagnation of air masses above pollutant-emitting areas. In addition, cooler temperatures led to an increase in emissions (notably linked to domestic wood heating) and the formation of “secondary” particles which formed after chemical reactions in the atmosphere.

Data V. Riffault/SAGE (Cappa and Climibio projects), CC BY-NC-ND


The graphs show changes in mass concentrations of PM10 and PM2.5 over a period of several days at the Lille Fives monitoring station, as well as changes in several chemical species measured in PM1 4 km away on the University of Lille campus.

We can see that almost all the particles fell within the PM2,5 proportion, something which rules out natural phenomena such as a dust being blown in from deserts, since such particles mainly fall within the range of 2.5 to 10 µm. Furthermore, the particles in question are generally smaller in size than 1 µm.

The pollution episode began on the evening of Friday January 21 and continued throughout weekend, in spite of a lower level of road traffic. This can be explained by an increase in wood burning (as suggested by the m/z 60 tracer, which is a fragment of levoglucosan, a molecule emitted by pyrolysis of cellulose found in wood).

Wood burning and other forms of combustion (such as traffic or certain industries) also emit nitrogen dioxide (NO2) as a gas, which can turn into nitric acid (HNO3) through a reaction with hydroxyl radicals (•OH) in the atmosphere.

At sufficiently low temperatures, HNO3 combines with ammonia (NH3) produced by farming activity to form ammonium nitrate (NH4NO3) solid. These are known as “secondary particles”.

A slight decrease in concentrations of particulate matter was observed at the end of the weekend, with more favorable weather conditions for the dispersion and elimination of pollutants.

In this episode, the very low concentrations of sulfates rule out an impact from coal power stations in Germany and Eastern Europe. It is therefore definitely a question of local and regional pollution linked to human activity and which accumulated as a result of unfavorable weather conditions.


How can this be avoided?

Since we cannot control the weather conditions, levers of action are primarily based on reducing pollutant emissions.

For example, reducing the formation of secondary particles will entail limiting NO2 emissions linked to road traffic through road space rationing measures; for NH3 emissions, action must be taken regarding farming practices (spreading and rearing methods).

Concerning emissions from wood heating, replacing older devices with cleaner ones will enable better burning and fewer particulate matter emissions; this could be accompanied by an investment in housing insulation.

But these measures should not make us forget populations’ chronic exposure to concentrations of particulate matter which exceed the recommended WHO thresholds. This type of pollution is insidious and is damaging to health in the medium and long term, notably with the development of cardio-vascular and respiratory diseases and lung cancer.