Underwater pipeline, Pipeline sous-marin, hydrocarbures, hydrates de méthane, crystallization, cristallisation

Understanding methane hydrate formation to revolutionize pipelines

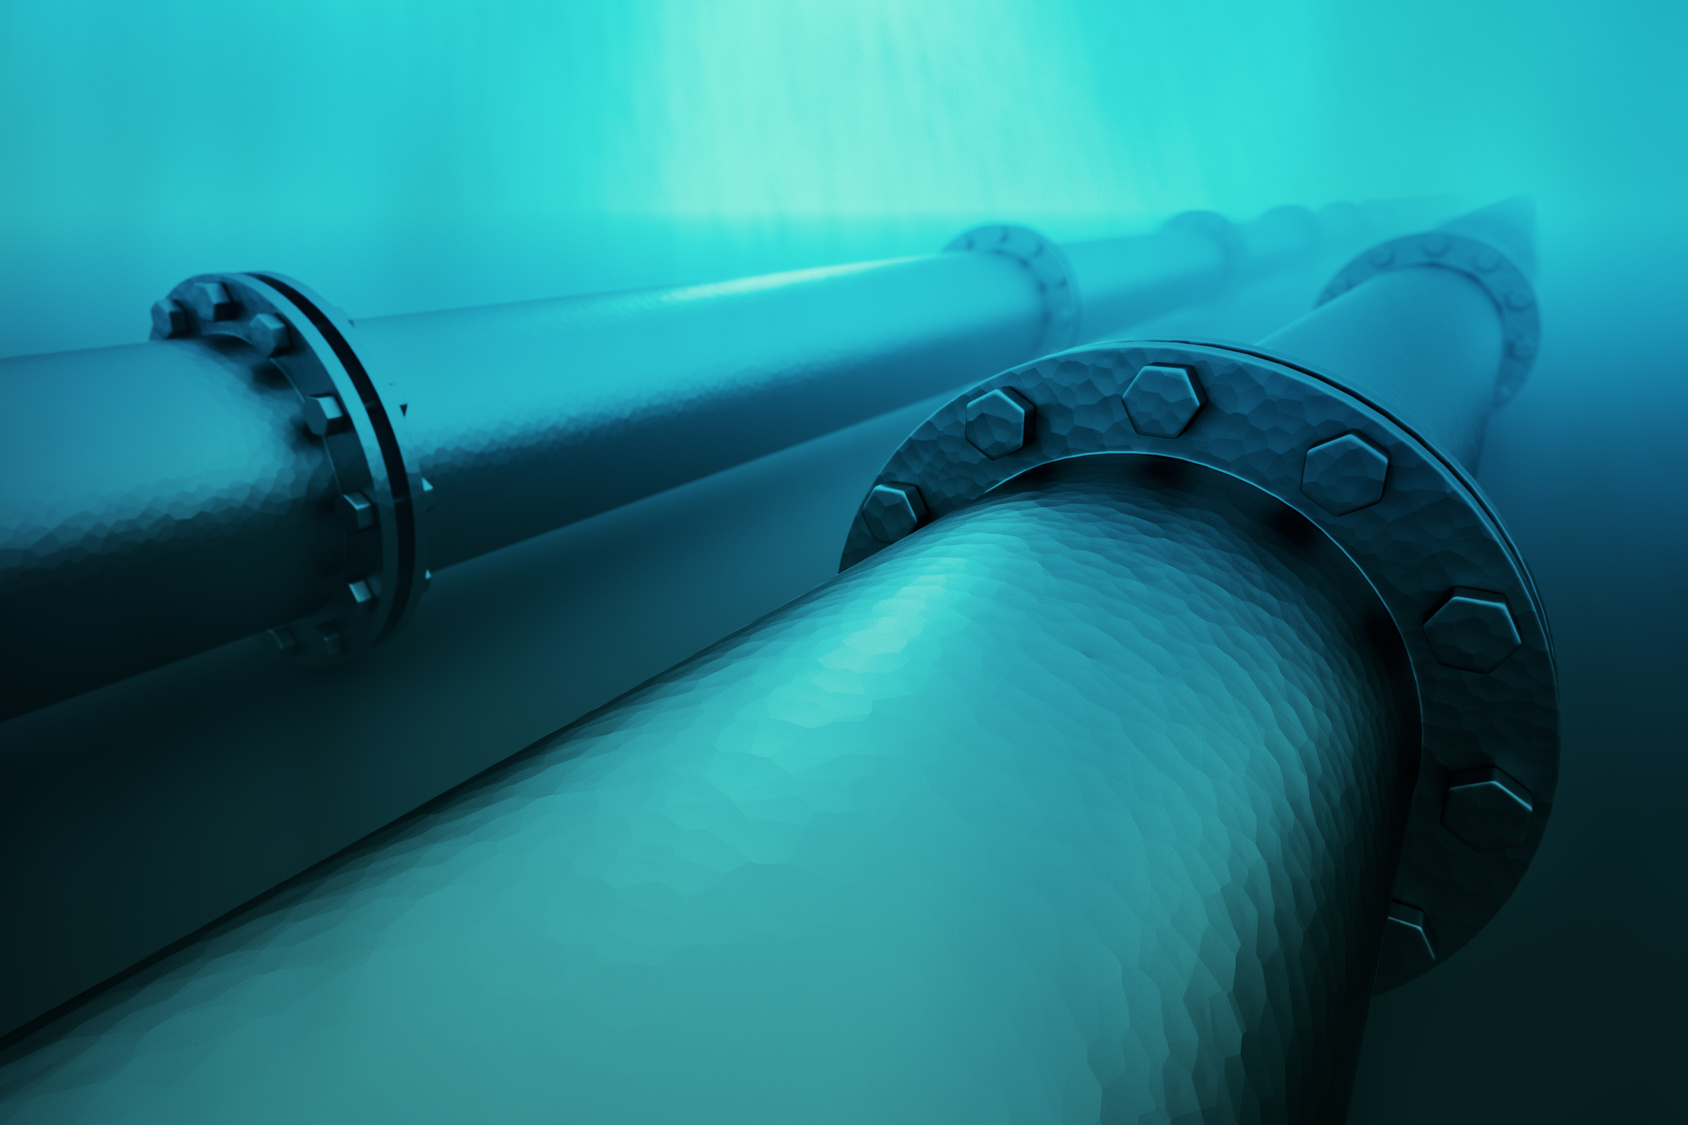
Since hydrocarbon is always drawn from deep in the sea floor, oil companies face potential obstruction problems in their pipelines due to the formation of solid compounds: methane hydrates. Ana Cameirao, an engineer and PhD specializing in industrial crystallization at Mines Saint-Étienne, is hoping to understand and model this phenomenon. She has contributed to the creation of an industrial chair in collaboration with international laboratories and operators such as Total, with the aim of developing a modelling software for the flow within the pipelines. Their mission is to achieve a more economic and ecological usage of underwater pipelines.


Always further, always deeper.” This is the logic behind the implementation of offshore platforms. Faced with the world’s intense demand and thanks to technological progress, hydrocarbon reserves which had previously been considered to be inaccessible are now exploitable. However, the industry has met an obstacle: methane hydrates. These solid compounds are actually solidified water molecules trapped in a sort of cage created by a methane molecule. These are created in environments of around 4°C and 80 bars of pressure, such as in deep-sea pipelines. These can end up accumulating and subsequently obstructing the flow. This issue may prove hard to fix, seeing as depths reach close to 3,000 meters!

In order to get around this problem, oil companies generally inject methanol into the pipelines in order to lower the formation temperature of the hydrates. However, injecting this alcohol carries an additional cost as well as an environmental impact. Additionally, systematic thermal insulation of pipelines is not sufficient to prevent the formation of hydrates. “The latest solution consists in injecting additives which are supposed to slow the formation and accumulation of hydrates”, explains Ana Cameirao, a researcher at the SPIN (Sciences des Processus Industriels et Naturels) research center at Mines Saint-Étienne, and a specialist in crystallization, the science behind the formation and growth of solid aggregates within liquid phases, for instance.


Towards the reasonable exploitation of pipelines

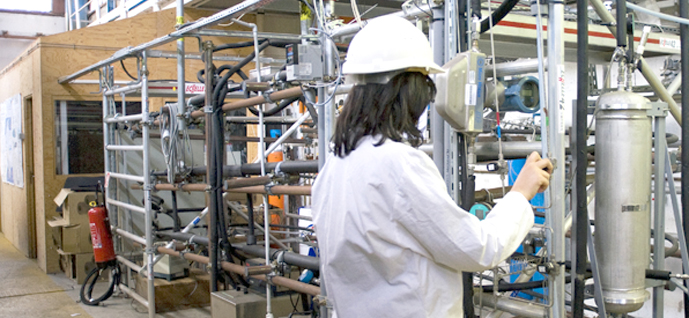
For nearly 10 years, the researcher has been studying the formation of hydrates in all conditions likely to occur in offshore pipelines. “We are looking to model the phenomenon, in other words, to estimate the quantity of hydrates formed, to see whether this solid phase can be transported through the flow, to find if there is a need to inject additives, and if yes, in what quantity”, she summarizes. The goal is to prompt a well-considered exploitation of the pipelines and avoid the massive injection of methanol as a preventative measure. In order to establish these models, Ana Cameirao utilizes a valuable experimental tool: the Archimedes platform.

This 50 meter loop located at the SPIN center allows her to reproduce the flow of the mixture of oil, water and gas which circulates in the pipelines. A plethora of equipment, including cameras and laser probes which function under very high pressure levels, allow her to study the formation of the solid compounds, including their size, nature, aggregation speed, etc. She has been closely examining all the possible scenarios: “we vary the temperature and pressure, but also the nature of the mix, for example by incorporating more or less gas, or by varying the proportion of water in the mixture”, explains Ana Cameirao.

Thanks to all these trials, in 2016, the researcher and her team published one of the most complete comprehension models about this phenomenon of methane hydrate crystallization. “Similar models do already exist, but only for fixed proportions of water. Our model is more extensive: it can integrate any proportion of water. This allows a greater variety of oil wells to be studied, including the oldest ones where the mixture can consist of up to 90% water!” This model is the product of painstaking work: over 150 experiments have been completed over the last 5 years, each of them representing at least two measurement days. Above all, it offers new perspectives: “Petrochemical process simulation software is very limited in explaining the flow in pipelines alongside hydrate formation. The main task is to invent modules that are able to take this phenomenon into consideration”, analyses Ana Cameirao.


Applications in environmental technology

This is the next step of a soon-to-be completed project: “We are currently aiming to combine our knowledge on crystallization of hydrates with that of experts on fluid mechanics, in order to better characterize their flow”. This multidisciplinary approach is the main subject of the international chair Gas Hydrates and Multiphase Flow in Flow Assurance, which was opened in January 2017 by the Mines school in collaboration with two laboratories hailing from the Federal University of Technology in Parana, Brazil (UTFPR), and the Colorado School of Mines  in the US. The chair, which will span over three to five years, also involves industrial partners, the top level of whom includes Total. “Total, who has been a partner of the research center for 15 years, not only offers financial support, but also shares with us its experience in real exploitation”, tells Ana Cameirao.


Credits: Mines Saint-Étienne


A better understanding of hydrate crystallization will facilitate the offshore exploitation of hydrocarbon, but it could also benefit environmental technology over time. Indeed, researchers are working on innovative application of hydrates, such as the harvesting of CO2 or new climate control techniques. “The idea would be to form hydrate sorbets overnight when energy is available and less expensive, in order to diffuse this through a climate control system during the daytime. As the hydrates melt, the heat in the surrounding area would be absorbed”, explains Ana Cameirao. Clearly, it seems that crystallization can lead to anything!


[author title=”Ana Cameirao : « Creativity comes first »” image=”https://imtech-test.imt.fr/wp-content/uploads/2017/09/Portrait_Ana_Cameirao.jpg”]

Ana Cameirao chose very early on to pursue a course in engineering in her home country of Portugal. “It was the possibility to apply the science which interested me, this potential to have a definitive impact on people’s lives”, she recalls. After finishing her studies in industrial crystallization at IMT Mines Albi, she threw herself into applied research. “It’s a constant challenge, we are always discovering new things”, she marvels, when looking back over her ten years at the SPIN center at Mines Saint Étienne.

Ana Cameirao also invokes creativity in her role as a professor, backed by innovative teaching methods which include projects, specific case studies, bibliographic independent learning, and much more. “Students today are no longer interested in two-hour lectures. You need to involve them”, she tells. The teacher feels so strongly about this topic that she decided to complete a MOOC dedicated to exploring methods for stimulating creativity, and plans to organize her own workshops on the subject within her school in 2018!

[/author]


vigisat, surveillance, environnement

VIGISAT: monitoring and protection of the environment by satellite

Belles histoires, Bouton, CarnotFollowing on from our series on the platforms provided by the Télécom & Société numérique Carnot institute, we will now look at VIGISAT, based near Brest. This collaborative hub is also a project focusing on the satellite monitoring of oceans and continents in high resolution.


On 12th July, scientists in Wales observed a drifting iceberg four times the size of London. The imposing block of ice detached from the Antarctic and is currently meandering around the Weddell Sea, and has now started to crack. This close monitoring of icebergs was made possible by satellite images.

Although perhaps not directly behind this observation, the Breton Observation Station, VIGISAT, is particularly involved in the matter of maritime surveillance. It also gathers useful information on protecting the marine and terrestrial environments. René Garello, a researcher at IMT Atlantique, presents the main issues.


What is VIGISAT?

René Garello: VIGISAT is a reception center for satellite data (radar sensors only) operated by CLS (Collecte Localisation Satellites) [1]. The station benefits from the expertise of the Groupement d’Intérêt Scientifique Bretagne Télédétection (BreTel) community, made up of nine academic members and partners from the socio-economic world. Its objective is to demonstrate the relevance of easy access data for the development of methods for observing the planet. It is at the service of the research community (for academic partners) and of the “end users” from a business perspective.

VIGISAT is also a project within the Breton CPER (Contrat de Plan État-Région) framework, which has been renewed to run until 2020. The station/project concept was named a platform by the Institut Carnot Télécom & Société Numérique at the end of 2014.


The VIGISAT station


What data does VIGISAT collect and how does it process this?

RG: The VIGISAT station receives data from satellites carrying Synthetic Aperture Radars (better known as SARs). This microwave sensor allows us to obtain very high resolution imaging of the Earth’s surface. The data received by the station therefore come from both the Canadian satellite RadarSAt-2, and in particular from the new series of European satellites: SENTINEL. These are sun-synchronous orbiting satellites [NB: the satellite always passes over a certain point at the same solar time], which move at an altitude of 800km and can circle the Earth in just 100 minutes.

We receive raw information collected by satellites, in other words, data come in the form of unprocessed bit streams. The data are then transmitted by fiber optic to the processing center which is also located on the site. “Radar images” are then constructed using the raw information and the radar’s known parameters. The final data, although in image form, require expert interpretation. In simple terms, the radar wave emitted is sensitive to the properties of the observed surfaces. In this way, the nature of the earth (vegetation, bare surfaces, urban landscapes, etc.) will send its own characteristic energy. Furthermore, the information required depends on the measuring device’s intrinsic parameters, such as the length of the wave or the polarization.


What scientific issues are addressed using VIGISAT data?

RG: CLS and researchers from members of the GIS BreTel are working on diverse and complementary issues. At IMT Atlantique or Rennes 1 University, we are mainly focusing on the methodological aspects. For example, for 20 years, we have had a high level of expertise on statistical processing of images. In particular, this allows us to identify areas of interest on terrestrial images or surface types on the ocean. More recently, we have been faced with the sheer immensity of the data we collect. We therefore put machine learning, data mining and other algorithms in place in order to fully process these databases.

Other GIS institutions, such as Ifremer or IUEM [2], are working on marine and coastal topics, in collaboration with us. For example, research has been carried out on estuary and delta areas, such as the Danube. The aim is to quantify the effect of flooding and its persistence over time.

Finally, continental themes such as urban planning, land use, agronomics and ecology are the main elements being studied by Rennes 2 University or Agrocampus. In the case of urban planning, satellite observations allow us to locate and map the green urban fabric. This allow us to estimate the allergenic potential of public spaces for example. It should be noted that a lot of these works, which began in the field of research, have led to the creation of some viable start-ups [3].

What projects has VIGISAT led?

RG: Since 2010, VIGISAT’s privileged data access has allowed it to back various other research projects. Indeed, it has created a lasting dynamic within the scientific community on the development of land, as well as the surveillance and controlled exploitation of land. Amongst the projects currently underway, there is for example CleanSeaNet, which focuses on the detection and monitoring of marine pollution. KALIDEOS-Bretagne looks at the evolution of land and landscape occupation and use on a town-countryside gradient. SESAME deals with the management and exploitation of satellite data for marine surveillance purposes.


Who is benefitting from the data analyzed by VIGISAT?

RG: Several targets were identified whilst preparing for the CPER 2015-2020 support request. One of these objectives is to generate activity in terms of the use of satellite data by Breton businesses. This includes the development of new public services based on satellite imaging in order to favor downstream services with regional affiliates development strategy.

One sector that benefits from the data and their processing is undoubtedly the highly reactive socio-economic world (i.e. start-ups, SMEs, etc.) that are based on the uses we discussed earlier. On a larger scale, protection and surveillance services are also addressed by the action coordinated by the developers and the suppliers of a service, such as GIS and the authorities at a regional, national and European level. By way of an example, BreTel has been a member of the NEREUS (Network of European Regions Using Space technologies) since 2009. This allows us to hold a strong position in the region as a center of expertise in marine surveillance (as well as in detection and monitoring of oil pollution) and also analyze ecological corridors in the context of biodiversity.

 [1] CLS is an affiliate of CNES, ARDIAN and Ifremer. It is an international business specializing in supplying Earth observation and surveillance solutions since 1986.
 [2] European Institute for Marine Studies
[3] Some examples of these start-ups include: e-ODYN, Oceandatalab, Hytech Imaging, Kermap, Exwews, and Unseenlab.

[box type=”info” align=”” class=”” width=””]

On VIGISAT:

The idea for VIGISAT began in 2001, with the start-up BOOST Technologies, which came out of IMT Atlantique (formerly Télécom Bretagne). From 2005, propositions were made to various partners including the Bretagne Region and the Brest Metropolis, in order to try and develop an infrastructure like VIGISAT on the campus close to Brest. Following BOOST Technologies’ merger with CLS in 2008, the project flourished after the creation of GIS BreTel in 2009. In the same year, the VIGISAT project experienced further success when presented to CPER. Then, BreTel grew its roadmap by adding the “research” sector, as well as the “training”, “innovation”, “promotion/dispersal” aspects. GIS BreTel is currently focusing on the “activity creation” and “new public services” sections which are in tune with the philosophy of the Carnot platforms.

BreTel also has a presence on a European level. GIS and its members have gained the title of “Copernicus Academy”. Thanks to this, they receive support from specialists in the European Copernicus program for all their education needs. From the end of 2017, BreTel and its partners will be participating in the Business Incubator Centers at ESA (ESA-BIC) which will cover five regions in Northern France (Brittany, Pays de la Loire, Ile-de-France, Hauts-de-France and Grand-Est), headed by the Brittany region.[/box]

[box type=”shadow” align=”” class=”” width=””]

The TSN Carnot institute, a guarantee of excellence in partnership-based research since 2006


Having first received the Carnot label in 2006, the Télécom & Société numérique Carnot institute is the first national “Information and Communication Science and Technology” Carnot institute. Home to over 2,000 researchers, it is focused on the technical, economic and social implications of the digital transition. In 2016, the Carnot label was renewed for the second consecutive time, demonstrating the quality of the innovations produced through the collaborations between researchers and companies. The institute encompasses Télécom ParisTech, IMT Atlantique, Télécom SudParis, Télécom, École de Management, Eurecom, Télécom Physique Strasbourg and Télécom Saint-Étienne, École Polytechnique (Lix and CMAP laboratories), Strate École de Design and Femto Engineering.[/box]

Also on I’MTech:

[box][one_half]

[/one_half][one_half_last]

[/one_half_last][/box]


data science, pierre tandeo

Environmental data: data science takes on the challenge

From July 3 to July 7, a series of conferences was held on data science and the environment. The event, organized by IMT Atlantique, builds bridges between two communities between whom there has been little collaboration in Europe so far. Environmental data could benefit from new processing methods that could help to explain what, until now, has been impossible for physics.


Some marine and atmospheric phenomena lack physical explanations, despite the observations that have been made. Could these explanations be found through a new method of analysis? The collaboration between data science and the environment is currently underdeveloped in Europe. Yet data scientists offer tools and methodologies that could be helpful in processing environmental data. With the goal of establishing a connection between these scientific communities, IMT Atlantique created a special conference series: “Data science & Environment”, bringing together researchers from around the world. This event is associated with a summer school in order to raise awareness of these mixed approaches among future researchers. Both events were initiated by Pierre Tandeo, a researcher already convinced that this collaboration will bear fruit. Specialized in mathematics applied to oceans and meteorology, he presents the issues related to this collaboration.


What is data science?

Pierre Tandeo: Data science is built on the analysis of data using mathematical and statistical tools. It is often confused with big data. Yet data science involves a “professional” aspect, meaning that it uses a scientific approach for extracting relevant, physics-related information related a specific subject matter. Big data, on the other hand, is not necessarily aimed at addressing questions related to physics.

It is often said that data scientists wear three hats, since they must master the mathematical and IT tools, and the data for a given subject. It is not easy to possess these three areas of expertise, which explains why we organized this conference. The goal is to cause the community of applied mathematics to intermingle with that of physics related to environmental data processing, in order to merge their skills in a move towards an environmental data science.


What kinds of environmental data can data scientists process?

PT: The conference focuses on the study of oceans, the atmosphere and climate. Within these areas, there are three main types of data: satellite observations, in situ measurements at sea or in the atmosphere, and simulations from computer models. These simulations are intended to describe the phenomena using physical equations.

Today, this data is becoming increasingly easy to access. It includes large volumes of information that have not yet been used, due to the processing challenges presented by these large sets of data. Manipulating the data sets is a complex undertaking, and special IT and statistical tools must be used to process them.


What can data science contribute to environmental research and vice versa?

PT:  Major environmental questions remain, and physical comprehension remains insufficient. What this means is that we are not able to convert what is observed into equations. The question is, can we try to understand these environmental phenomena using data, since the connections are undoubtedly hidden within it? To reveal this data, a suitable mathematical tool must be built.

Also, when we check the weather, for example, we don’t trust the forecasts that are made beyond one week’s time, because the system is complex. It’s called “chaotic.” The difficulty in forecasting environmental data lies in the fact that many interactions can take place between the variables that physics cannot even explain. This complexity requires a revision of the applied mathematical techniques that are commonly used. The environment forces us to rethink the way data is processed. This makes it an ideal field for data science, since it is hard to master, thus providing a challenge for mathematicians.


Can you give us an example of an environmental issue that has benefited from a mathematical approach?

PT: Some statistical approaches have proven successful. Forecasting the coupled atmosphere-ocean phenomenon called ENSO (with its two opposite phases: El Nino/La Nina) is a good example. The two ENSO phases appear irregularly (every 2 to 7 years) and have extremely significant human, economic and ecological impacts [they particularly affect North and South America]. Therefore, physicists try to predict six months in advance whether we will experience a normal year, El Nino (unusually hot) or La Nina (unusually cold). The ENSO predictions from statistical models were often found to be better than the predictions provided by physical models. These statistical forecasts are based on learning from historical data that is constantly increasing, particularly since the use of satellites.

This conference also provided an opportunity to identify other environmental challenges that remain unresolved, for which data science could provide a solution. It is a vast and rapidly growing field.

Also read on I’MTech:
Ocean remote sensing: solving the puzzle of missing data


What topics will be discussed at the conferences?

PT:  The first half focuses on the applications of data science for the climate, atmosphere, and oceans. Yet we have observed that applied mathematical methods are more widespread among the atmosphere and climate community. I think oceanographers have things to learn from what is being done elsewhere. That is also why the event is being held in Brest, one of the major European oceanographic centers.

The other sessions are devoted to mathematical methodologies, and are aimed at presenting how high dimensional problems—with a large volume of information—can be processed, and how to extract relevant information. Data assimilation is also addressed. This looks at the question of how physical forecast models can be mixed with satellite data. The last focus is on analog methods, which involve using learning techniques based on historical observations and trying to project them on current or future data.


What are the anticipated outcomes of these sessions?

PT: In the short term, the goal is to start conversations. I would like to see two researchers from both communities finding common ground, because they both have something to gain. In the medium term, the goal is to make this an ongoing event. Ideally, we would like to repeat the event in other locations in France, or in Europe, and open it up to other types of environmental data over the next two years. Finally, the long-term goal would be to initiate projects involving international collaboration. Along with several colleagues, we are currently working to establish a French-American project on the applications of applied mathematics for climate. The creation of international mixed research units in these areas would mark a true culmination.


Fine particulate pollution: can we trust microsensor readings?

Nathalie RedonIMT Lille Douai – Institut Mines-Télécom

Last May, Paris City Hall launched “Pollutrack”: a fleet of micro sensors placed on the roofs of vehicles traveling throughout the capital to measure the amount of fine particles present in the air in real-time. A year before, Rennes proposed that residents participate in assessing the air quality via individual sensors.

In France, for several years, high concentrations of fine particles have been regularly observed, and air pollution has become a major health concern. Each year in France, 48,000 premature deaths are linked to air pollution.

The winter of 2017 was a prime example of this phenomenon, with daily levels reaching up to 100µg/m3 in certain areas, and with conditions stagnating for several days due to the cold and anticyclonic weather patterns.


A police sketch of the fine particle

A fine particle (particulate matter, abbreviated PM) is characterized by three main factors: its size, nature and concentration.

Its size, or rather its diameter, is one of the factors that affects our health: the PM10 have a diameter ranging from 2.5 to 10μm; PM2.5, a diameter less than 2.5μm. By way of comparison, one particle is approximately 10 to 100 times finer than a hair. And this is the problem: the smaller the particles we inhale, the more deeply they penetrate the lungs, leading to an inflammation of the lung alveoli, as well as the cardiovascular system.

The nature of these fine particles is also problematic. They are made up of a mixture of organic and mineral substances with varying degrees of danger: water and carbon form the base around which condense sulfates, nitrates, allergens, heavy metals and other hydrocarbons with proven carcinogenic properties.

As for their concentration, the greater it is in terms of mass, the greater the health risk. The World Health Organization recommends not to exceed personal exposure of 25 μg/m3 for the PM2.5 as a 24-hour average and 50 μg/m3 for the PM10. In recent years, thresholds have been constantly exceeded, especially large cities.


particules fines

The website for the BreatheLife campaign, created by WHO, where you can enter the name of a city and find out its air quality. Here, the example of Grenoble is given.


Humans are not the only ones affected by the danger of these fine particles: when they are deposited, they contribute to the enrichment of natural environments, which can also lead to an eutrophication, phenomena, meaning excess amounts of nutriments, such as the nitrogen carried by the particles, are deposited in the soil or water. For example, this leads to algal blooms that can suffocate local ecosystems. In addition, due to the chemical reaction of the nitrogen with the surrounding environment, the eutrophication generally leads to soil acidification. Soil that is more acidic becomes drastically less fertile: vegetation becomes depleted, and slowly but inexorably, species die off.


Where do they come from?

Fine particle emissions primarily originate from human activities: 60% of PM10 and 40% of PM2.5 are generated from wood combustion, especially from fireplace or stove heating, 20% to 30% originate from automotive fuel (diesel is the number one). Finally, nearly 19% of national PM10 emissions, and 10% PM2.5 emissions result from agricultural activities.

To help public authorities limit and control these emissions, the scientific community must improve the identification and quantification of these sources of emissions, and must gain a better understanding of their spatial and temporal variability.


Complex and costly readings

Today, fine particle readings are primarily based on two techniques.

First, samples are taken from filters; these are taken after an entire day and are then analyzed in a laboratory. Aside from the fact that the data is delayed, the analytical equipment used is costly and complicated to use; a certain level of expertise is required to interpret the results.

The other technique involves making measurements in real time, using tools like the Multi-wavelength Aethalometer AE33, a device that is relatively expensive, at over €30,000, but has the advantage of providing measurements every minute or even under a minute. It is also able to monitor black carbon (BC): it can identify the particles that originate specifically from combustion reactions. The aerosol chemical speciation monitor (ACSM) is also worth mentioning, as it makes it possible to identify the nature of the particles, and takes measurements every 30 minutes. However, its cost of €150,000 means that access to this type of tool is limited to laboratory experts.

Given their cost and level of sophistication, there are a limited number of sites in France that are equipped with these tools. Thanks to these simulations, the analysis of daily averages makes it possible to create maps with a 50km by 50km grid.

Since these means of measurement do not make it possible to establish a real-time map with finer spatio-temporal scales—in terms of the km2 and minutes—the scientists have recently begun looking to new tools: particle microsensors.


How do microsensors work?

Small, light, portable, inexpensive, easy to use, connected… microsensors appear to offer many advantages that complement the range of heavy analytical techniques mentioned above.

But how credible are these new devices? To answer this question, we need to look at their physical and metrological characteristics.

At present, several manufactures are competing for the microsensor market: the British Alphasense, the Chinese Shinyei and the American manufacturer, Honeywell. They all use the same measurement method: optical detection using a laser diode.

The principle is simple: the air, sucked in by the fan, flows through the detection chamber, which is configurated to remove the larger particles, and retain only the fine particles. The air, loaded with particles, flows through the optical signal emitted by the laser diode, the beam of which is diffracted by a lens.

A photodetector placed opposite the emitted beam records decreases in luminosity caused by the passing particles, and counts the number by size ranges. The electrical signal from the photodiode is then transmitted to a microcontroller that processes the data in real time: if the air flow rate is known, the concentration number can then be determined, and then the mass, based on the size ranges, as seen in the figure below.


An example of a particle sensor (brand: Honeywell, HPM series)


From the most basic to the fully integrated version (including acquisition and data processing software, and measurement transmission via cloud computing), the price can range from €20 to €1,000 for the most elaborate systems. This is very affordable, compared to the techniques mentioned above.


Can we trust microsensors?

First, it should be noted that these microsensors do not provide any information on the fine particles’ chemical composition. Only the techniques described above can do that. However, knowledge of the particles’ nature provides information about their source.

Furthermore, the microsensor system used to separate particles by size is often rudimentary; field tests have shown that while the finest particles (PM2.5) are monitored fairly well, it is often difficult to extract the PM10 fraction alone. However, the finest particles are precisely what affect our health the most, so this shortcoming is not problematic.

In terms of the detection/quantification limits, when the sensors are new, it is possible to reach reasonable thresholds of approximately 10µg/m3. They also have sensitivity levels between 2 and 3µg/m3 (with an uncertainty of approximately 25%), which is more than sufficient for monitoring the dynamics of how the particle concentrations change in the concentration range of up to 200µg/m3.

However, over time, the fluidics and optical detectors of these systems tend to become clogged, leading to errors in the results. Microsensors must therefore be regularly calibrated by connecting them to reference data, such as the data released by air pollution control agencies.

This type of tool is therefore ideally suited for an instantaneous and semi-quantitative diagnosis. The idea is not to provide an extremely precise measurement, but rather to report on the dynamic changes in particulate air pollution on a scale with low/medium/high levels. Due to the low cost of these tools, they can be distributed in large numbers in the field, and therefore help provide a better understanding of particulate matter emissions.


Nathalie Redon, Assistant Professor, Co-Director of the “Sensors” Laboratory, IMT Lille Douai – Institut Mines-Télécom

This article was originally published in French on The Conversation.


qualité de l'air, modélisation, air quality, modeling

Air quality: several approaches to modeling the invisible

The theme day on air quality modeling (organized by FIMEA and IMT Lille Douai) on June 8 provided an opportunity for researchers in this field to exchange on existing methods. Modeling makes it possible to identify the link between pollution sources and receptors. These models help provide an understanding of atmospheric processes and air pollution prevention.


What will the pollution be like tomorrow? Only one tool can provide answer: modeling. But what is modeling? It all depends the area of expertise. In the field of air quality, this method involves creating computer simulations to represent different scenarios. For example, it enables pollutant emissions to be simulated before building a new highway. Just as meteorological models predict rain, an air quality model predicts pollutant concentrations. Modeling also provides a better understanding of the physical and chemical reactions that take place in the atmosphere. “There are models that cover smaller and larger areas, which make it possible to study the air quality for a continent, region, or even for one street,” explains Stéphane Sauvage, a researcher with the Atmospheric Sciences and Environmental Engineering Department (SAGE) at IMT Lille-Douai. How are these models developed?


Models, going back to the source

The first approach involves identifying the sources that emit the pollutants via field observations, an area of expertise at IMT Lille-Douai. Sensors located near the receptors (individuals, ecosystems) measure the compounds in the form of gas or particles (aerosols). The researchers refer to certain types that are detected as tracers, because they are representative of a known source of emissions. “Several VOC (Volatile Organic Compounds) are emitted by plants, whereas other kinds are typical of road traffic. We can also identify an aerosol’s origin (natural, wood combustion…) by analyzing its chemical composition,” Stéphane Sauvage explains.

The researchers study the hourly, daily, and seasonal variability of the tracers through statistical analysis. These variations are combined with models that trace the path air masses followed before reaching the observation site. “Through this temporal and spatial approach, we can succeed in reproducing the potential areas of origin. We observe ‘primary’ pollutants, which are directly emitted by the sources, and are measured by the receptors. But secondary pollutants also exist; the result of chemical reactions that take place in the atmosphere,” the researcher adds. To identify the sources of this second category of pollutants, researchers identify the reactions that could possibly take place between chemical components. This is a complex process, since the atmosphere is truly a reactor, within which different species are constantly being transformed. Therefore, the researchers come up with hypotheses to enable them to find the sources. Once these models are functional, they are used as decision-making tools.


Models focused on receptors

A second approach, referred to as the “deterministic” modeling, is focused on the receptors. Based on what they know about the sources (concentrations of industrial waste and of road traffic…), the researchers use air mass diffusion and movement models to visualize the impact these emissions have on the receptor. To accomplish this, the models integrate meteorological data (wind, temperature, pressure…) and the equations of the chemical reactions taking place in the atmosphere. These complex tools require a comprehensive knowledge of atmospheric processes and high levels of computing power.

These models are used for forecasting purposes. “air pollution control agencies use them to inform the public of the levels of pollutants in a given area. If necessary, the prefecture can impose driving restrictions based on the forecasts these models provide,” explains Stéphane Sauvage. This modeling approach also makes it possible to simulate environmental impact assessments for industrial sites.


Complementary methods

Both methods have their have limits and involve uncertainties. The models based on observations are not comprehensive. “We do not know how to observe all the species. In addition, this statistical approach requires a large amount of observations to be made before a reliable and robust model can be developed. The hypotheses used in this approach are simplistic compared to the receptor-focused models,” Stéphane Sauvage adds. The other type of model also relies on estimations. It uses data that can be uncertain, such as the estimation of the sources’ emissions and the weather forecasts.

We can combine these two methods to obtain tools that are more effective. The observation-based approaches make it possible to assess information about the sources, which is useful for the deterministic models. The deterministic models are validated by comparing the predictions with the observations. But we can also integrate the observed data into the models to correct them,” the researcher adds. This combination limits the uncertainties involved and supports the identification of links between the sources and receptors. The long-term objective is to propose decision-making tools for policies aimed at effectively reducing pollutants.


electromagnetic waves

Our exposure to electromagnetic waves: beware of popular belief

Joe Wiart, Télécom ParisTech – Institut Mines-Télécom, Université Paris-SaclayJoe Wiart, Exposition ondes électromagnétiques

This article is published in partnership with “La Tête au carré”, the daily radio show on France Inter dedicated to the popularization of science, presented and produced by Mathieu Vidard. The author of this text, Joe Wiart, discussed his research on the show broadcast on April 28, 2017 accompanied by Aline Richard, Science and Technology Editor for The Conversation France.


For over ten years, controlling exposure to electromagnetic waves and to radio frequencies in particular has fueled many debates, which have often been quite heated. An analysis of reports and scientific publications devoted to this topic shows that researchers are mainly studying the possible impact of mobile phones on our health. At the same time, according to what has been published in the media, the public is mainly concerned about base stations. Nevertheless, mobile phones and wireless communication systems in general are widely used and have dramatically changed how people around the world communicate and work.

Globally, the number of mobile phone users now exceeds 5 billion. And according to the findings of an Insee study, the percentage of individuals aged 18-25 in France who own a mobile phone is 100%! It must be noted that the use of this method of communication is far from being limited to simple phone calls — by 2020 global mobile data traffic is expected to represent four times the overall internet traffic of 2005.  In France, according to the French regulatory authority for electronic and postal communications (ARCEP), over 7% of the population connected to the internet exclusively via smartphones in 2016. And the skyrocketing use of connected devices will undoubtedly accentuate this trend.


electromagnetic waves

Smartphone Zombies. Ccmsharma2/Wikimedia


The differences in perceptions of the risks associated with mobile phones and base stations can be explained in part by the fact that the two are not seen as being related. Moreover, while exposure to electromagnetic waves is considered to be “voluntary” for mobile phones, individuals are often said to be “subjected” to waves emitted by base stations. This helps explains why, despite the widespread use of mobiles and connected devices, the deployment of base stations remains a hotly debated issue, often focusing on health impacts.

In practice, national standards for limiting exposure to electromagnetic waves are based on the recommendations of the International Commission on Non-Ionizing Radiation Protection (ICNIRP) and on scientific expertise. A number of studies have been carried out on the potential effects of electromagnetic waves on our health. Of course, research is still being conducted in order to keep pace with the constant advancements in wireless technology and its many uses. This research is even more important since radio frequencies from mobile telephones have now been classified as “possibly carcinogenic for humans” (group 2B) following a review conducted by the International Agency for Research on Cancer.

Given the great and ever-growing number of young people who use smartphones and other mobile devices, this heightened vigilance is essential. In France the National Environmental and Occupational Health Research Programme (PNREST) of the National Agency for Food, Environmental and Occupational Health Safety (Anses) is responsible for monitoring the situation. And to address public concerns about base stations (of which there are 50,000 located throughout France), many municipalities have discussed charters to regulate where they may be located. Cities such as Paris, which, striving to set an example for France and major European cities, signed such a charter as of 2003, are officially limiting exposure from base stations through a signed agreement with France’s three major operators.

Exposition ondes électromagnétiques, Joe Wiart

Hillside in Miramont, Hautes Pyrenees France. Florent Pécassou/Wikimedia

This charter was updated in 2012 and was further discussed at the Paris Council in March, in keeping with the Abeille law, which was proposed to the National Assembly in 2013 and passed in February 2015, focusing on limiting the exposure to electromagnetic fields. Yet it is important to note that this initiative, like so many others, concerns only base stations despite the fact that exposure to electromagnetic waves and radio frequencies comes from many other sources. By focusing exclusively on these base stations, the problem is only partially resolved. Exposure from mobile phones for users or their neighbors must also be taken into consideration, along with other sources.

In practice, the portion of exposure to electromagnetic waves which is linked to base stations is far from representing the majority of overall exposure. As many studies have demonstrated, exposure from mobile phones is much more significant.  Fortunately, the deployment of 4G, followed by 5G, will not only improve speed but will also contribute to significantly reducing the power radiated by mobile phones. Small cell network architecture with small antennas supplementing larger ones will also help limit radiated power.  It is important to study solutions resulting in lower exposure to radio frequencies at different levels, from radio devices to network architecture or management and provision of services. This is precisely what the partners in the LEXNET European project set about doing in 2012, with the goal of cutting public exposure to electromagnetic fields and radio frequency in half.

In the near future, fifth-generation networks will use several frequency bands and various architectures in a dynamic fashion, enabling them to handle both increased speed and the proliferation of connected devices. There will be no choice but to effectively consider the network-terminal relationship as a duo, rather than treating the two as separate elements. This new paradigm has become a key priority for researchers, industry players and public authorities alike. And from this perspective, the latest discussions about the location of base stations and renewing the Paris charter prove to be emblematic.


Joe Wiart, Chairholder in research on Modeling, Characterization and Control of Exposition to Electromagnetic Waves at Institut Mines Telecom, Télécom ParisTech – Institut Mines-Télécom, Université Paris-Saclay

This article was originally published in French in The Conversation France The Conversation

télédétection, remote sensing

Remote sensing explained: from agriculture to major disasters

There are numerous applications for remote sensing, from precision agriculture to helping with the deployment of aid in major disasters. Grégoire Mercier, a researcher at IMT Atlantique, explains the key notions of this remote observation method using examples from his research.


Detecting invisible objects from space… this is now possible through remote sensing. This remote observation method is currently used in monitoring air quality in urban areas, monitoring ecosystems, detecting illegal fishing etc. Its applications are as numerous as the territories that can be covered. Its aim: to spatialize information that would otherwise be located by measurements on the ground.

Over the past few years, Brittany has become a key player in certain remote sensing topics in France and Europe through GIS Bretel and the Vigisat observation platform, “We are going through an interesting period for remote sensing, because we are carrying out missions with an operational purpose”, explains Grégoire Mercier, a researcher at IMT Atlantique who specializes in remote sensing image processing. “We can respond to issues concerning civil society and not just show that we can observe clouds using images” he adds. With the help of our expert, we will provide an overview of the key elements of remote sensing, from methods to applications.


Retracing the history of signals in remote sensing

Grégoire Mercier defines remote sensing as “any remote observation for which electromagnetic radiation is used to study the interaction between waves and matter. Depending on the result, we obtain an understanding of the object which has interacted with the wave”.

Photons are a key element in both spatial and airborne remote sensing. Thousands of them travel through space at the speed of light until they reach the Earth’s atmosphere. At this point, things become more complicated due to the atmosphere itself, clouds and aerosols. The atmosphere is full of obstacles which may prevent photons reaching the Earth’s surface. For example, when a photon comes into contact with a particle or water droplet, it is partially reflected and/or absorbed and sends new waves out in random directions. If it successfully reaches the ground, what happens next depends on where it lands. Vegetation, oceans, lakes or buildings… the reflected radiation will differ according to the object struck.

Every element has its own spectral signature which later enables it to be identified on the remote sensing images obtained using an in-built sensor on a satellite, aircraft or drone.


Spectral response and remote observations

Every object has a unique signature. “When we observe chlorophyll, lots of things appear in green, we see absorption of red and, a step further on, we observe a very specific response in the near-infrared region”, explains Grégoire Mercier. Observation of these spectral responses indicates that the remotely observed zone is of a vegetal nature. However, these observations are adjusted according to the moisture and the presence of pathosystems (a bacterial disease in the plant). The latter modify the plant’s spectral “ID card”. This is how researchers detect hydric stress or infections before the effects become visible to the naked eye. The process is particularly useful in precision agriculture.

Airborne remote sensing provides information on practices and the evolution of landscapes. “At IMT Atlantique we worked in collaboration with the COSTEL laboratory on the characterization of wetland areas in agriculture. The aim was to create a tool for operational purposes. We were able to prove that the use of hedges helped prevent surface run-off and therefore the pollution of water courses.”


Active/passive remote sensing and wavelengths

There are two types of remote sensing depending on the type of sensor used. When we use the sun’s radiation for observation, we talk of passive remote sensing. In these cases, the sensors used are referred to as “optic”. The wavelengths in question (typically between 400 and 2,500 nanometers) allow lenses to be used. “The electromagnetic wave interacts with the molecular energy level on a nanometric scale, which enables us to observe the constituents directly,” explains Grégoire Mercier. This is how the composition of the Earth’s atmosphere can be observed, for example.

But observations are not purely limited to the visible field of the electromagnetic spectrum. The aim is to go beyond the human visual system with observations in the thermal infrared range (up to 5 mm in wavelength) and of microwaves (centimetric or decimetric wavelengths). “When we use wavelengths that are no longer nanometric, but centimetric, the wave/matter interaction with these electromagnetic waves is completely different”, explains Grégoire Mercier.

These interactions are characteristic of radar observations. This time, it is a question of active remote sensing because a wave is emitted toward the surface by the sensor before it receives the response. “For these wavelengths (from 1 centimeter to 1 meter), everything happens as though we were blind and touching the surface with a hand the size of the wavelength. If the surface is flat, we won’t see anything because we won’t feel anything. The texture of an element provides information.” In other words, radar observation of the sea’s surface reveals ripples corresponding to capillary waves. If we look at a lake, on the other hand, nothing can be seen. This helps scientists identify what they are observing.


Image processing and applications for large-scale disasters

Grégoire Mercier has made improving sensing methods part of his daily work. “My research is based on operational methods that aim to detect changes with a high level of reliability”, explains Grégoire Mercier. More particularly, the researcher addresses image analysis in time-related applications. He has collaborated with the CNES on the creation of tools used during major disasters.

Initiated in 2000 by the CNES and ESA, the international charter on “Space and natural disasters” currently unites 16 space agencies from all over the world. The charter can be activated following a major natural or industrial disaster depending on the level of severity. “There is always one space agency on watch. When the charter is activated, it must do everything possible to update the map of the affected area”, explains Grégoire Mercier. To obtain this post-disaster map, the space agency requisitions any available satellite, which it uses to map the zone before the deployment of civilian security. The objective must generally be achieved in three hours.

“Rapid mapping does not allow you to choose the most suitable sensor or the best perspective. The observation then has to be compared to the one corresponding to the previous situation, which can be found in databases. The problem is that the images will probably not have been produced by the same sensor and will not have the same spatial resolution, so the idea is to implement tools that will facilitate comparison of the two images and the management of heterogeneous data. That’s where we come in,” Grégoire Mercier continues.

Also see the video on I’MTech: Communicating in emergencies and natural disasters

Having exceeded the initial aims of the SPOT satellite (Satellite for Observation of the Earth), remote sensing has sufficiently proven its worth for it to become a vital tool for the observation of territories. The task is now to establish operational image processing methodologies, as proposed by the ANR PHOENIX project.


[divider style=”normal” top=”20″ bottom=”20″]

Remote sensing for monitoring the natural evolution of a landscape: the ANR PHOENIX project

Grégoire Mercier is involved in the ANR PHOENIX project. Launched in 2015, the project notably aims to establish reliable remote sensing methodologies which will be used in characterizing the natural evolution of landscapes. In this way, it will be possible to analyze large-scale structures such as alpine glaciers and the Amazonian rainforest at different periods to determine the impact of various types of changes on their evolution. The use of satellite data for monitoring the environment will allow analysis of its current state and forecasting of its future state. Find out more

[divider style=”normal” top=”20″ bottom=”20″]


Also read on I’MTech:

[one_half]

[/one_half][one_half_last]

[/one_half_last]

green it, epoc, cloud computing, data center

Data centers: Taking up the energy challenge

Increasingly present throughout the world, data centers consume significant amounts of energy. Researchers at IMT Atlantique have conducted a study that combines renewable energy and electricity grids to power these infrastructures. To reduce energy consumption, scientists are also looking at the network and the anticipation and organization of tasks on the various servers.


Accessing this website via a search engine consumes four times more CO2 than getting here by typing the website address or using a bookmark shortcut, according to the ADEME. [1] While it is easy to forget, because of its lack of physical presence, that digital technology emits greenhouse gases, it is important to remember that data centers emit as much carbon dioxide as civil aviation (2% of global emissions) due to their electricity consumption. This observation is far from trivial, considering the significant increase in the number of data centers around the world. Furthermore, with the arrival of cloud computing, data centers are consuming increasing amounts of energy, leading to ecological and economic problems.

With each new data center that opens, reducing the environmental impact is therefore a key consideration. With the aim of reducing energy consumption, the EPOC collaborative project (Energy Proportional and Opportunistic Computing systems) combines alternative energies and the EDF grid to power single-site infrastructures containing around fifty servers. This purely theoretical project, launched in 2013 and financed by the Labex CominLabs, brings together researchers in computer science and telecommunications from IMT Atlantique. For this Green IT project, the researchers’ skills in computer optimization, virtualization, and software adaptation are combined with expertise in very high-speed optical networks. Let’s take a look at the theory at the heart of this project, while awaiting its implementation.


Technical optimization

In the EPOC theory, data centers are connected to the EDF grid, while still being powered by renewable energy. This renewable energy provides electricity in a discontinuous manner, unlike the electricity provided by the traditional network. For example, in the case of a photovoltaic panel, there is a surge in electricity when the sun is at its peak, whereas there is no production at night. “Currently, the most expensive aspect in a renewable energy electric system is the batteries used to store the energy that is not consumed. We would like to do away with the storage aspect and try to consume the electricity that is produced directly,” explains Jean-Marc Menaud, a researcher specialized in Green IT at IMT Atlantique and the EPOC coordinator. This is yet another reason to optimize the cost-effectiveness of this heterogeneous distribution of energy, and power the data centers in a consistent manner over time.

To achieve these goals, the researchers are improving network communication in particular. They have opted for an installation that is entirely connected via fiber optic technology. This reduces energy consumption during transfers between the servers. The transmission of information via a fiber optic system or, in other words, via light signals, consumes less electricity than an ADSL connection. ADSL, for example, uses cables containing copper and equipment that constantly consumes electricity.


Organizing tasks according to the electrical load

Once they are running and connected to a network, data centers are able to host two types of applications. Some, like search engines, require a constant online connection. Others must be performed before a deadline. The researchers are therefore able to coordinate the applications being used based on the energy received. When green energy is available, they can organize the tasks the way they like. Jean-Marc Menaud gives us an example: “at the end of every month, the accounting services must create the pay stubs in PDF format. These files must be available by the 30th of each month, but can be produced any time before this date. They can therefore be created when a high level of green electricity is available.

In addition to the number of tasks in progress, it is also possible to play on the applications that are always online. The goal of a data center is to constantly ensure a certain level of quality of service, or SLA (Service Level Agreement). This is a question of software elasticity, meaning the ability to adapt an application’s operation according to the available energy. Take, for example, a website used to evaluate a trip from one point to another. Its SLA consists in providing a route within a given time frame. If the electrical load is low, it will only meet these simple requirements. If, however, the green electricity rate is high, the website can provide alternative routes, hence improving the service provided.


Regulating the workload

Reducing energy consumption also involves reducing the number of servers that are running. Before turning a server off, the applications running on it must be transferred to another server. To do this, the researchers use the virtual machine principle. The researchers have two possibilities for relieving the workload on a server: they either suspend the calculation, or they perform a migration using virtual machines. This process of scheduling tasks on the servers is a complex problem. It is, above all, a question of placement and distribution.

Jean-Marc Menaud explains: “This principle of placement is similar to the principle involved in filling a backpack. Imagine you are leaving for a trek with a 60-liter backpack. You can choose from a wide variety of food items to take with you. Each food item has a calorific value, a volume and a weight. Your goal is to gather a maximum amount of calories within the limitations of a backpack with a set volume, while minimizing the final weight. The solution is easy when there are only 5 food items. But if you have 10,000 items, the problem becomes more complex, because it is impossible to test all the possibilities. Here we have a similar situation. A server is a backpack that can contain a certain quantity of virtual machines. We must maximize the service provided (the calories) and minimize the energy (the weight).


SeDuCe: a full-scale test data center

The last area the EPOC researchers are studying is anticipation. Predicting an application’s energy needs, combined with the electricity production forecast, is the key to responsible consumption. This is an aspect that will be directly tested in 2017, with the implementation of the CPER [2] SeDuCe (Sustainable Data Center) project, the logical follow-up to three years of theory. It will enable a test single-site data center to be established, powered by photovoltaic panels. This complete infrastructure will enable the practical analysis of the theories being developed through EPOC. “This type of site is rare in France. They are only beginning to emerge at the industrial level. With photovoltaic panels that are increasingly affordable, we will be able to test the hypotheses of this advanced research directly. The site should be operational by the summer of 2017″, Jean-Marc Menaud concludes.


[1] ADEME: The French Environment and Energy Management Agency (Agence De l’Environnement et de la Maîtrise de l’Energie)

[2] CPER: French State-Regional Plan Contract (Contrat Plan Etat-Région)


Radioactivity, SMART, IMT Atlantique

SMART: radioactive expertise at the service of the environment

Nuclear power stations are not the only sources of radioactivity in France. Other sources undeniably include hospitals and the construction industry, for example. Given the potential dangers to health and the environment, such sites have to be permanently tested. SMART, a team of experts in radioactivity from SUBATECH is a necessary third-party actor in this domain. The team brings objectivity and quality to field measurements and laboratory analyses. It handles regulations on radioactivity and thereby contributes to monitoring the environment.


SMART. No, this isn’t an article about the latest model of the famous subcompact car, but the Service for the Measurement and Analysis of Radioactivity and Trace elements. This team of experts (technicians and engineers) which is part of SUBATECH,[1] is not restricted by the usual laboratory and research standards. This freedom gives them a broad scope for responding to very specific questions. “We can answer any question that concerns the measurement of radioactivity,” explains Isabelle Deniau, Senior Technical Engineer at SMART. So, if you want to determine the true nature of a diamond, or find out the origin of a wooden floor, SMART’s doors are wide open and its advice is readily available.

But the range of offerings proposed by these radioactivity experts goes further than answering such unusual questions. Any organization using radioactive sources, such as Engie, AREVA, the CEA, hospitals or the construction industry, can benefit from SMART’s services. These direct or indirect actors in the industry of nuclear energy are subject to strict regulations in terms of tests and waste in order to protect citizens’ health and the environment.


Radioactivity tests for monitoring the environment

When we talk of radioactivity, the image of a nuclear power plant often enters our minds. This is hardly surprising in France, given that nuclear power is the leading source of energy, accounting for 77% of all power generation (according to the Electricity Transmission Network – RTE). Nuclear power stations are tested regularly because of the dangers they can lead to. The SMART laboratory works directly on the ground to analyze nuclear waste and put in place impact measurements, notably for the ASN (Nuclear Safety Agency). “Broadly speaking, the laboratory contributes to monitoring the environment in France”, explains Isabelle Deniau.

“We conduct analyses of grass, moss, leaves… anything that may absorb radioactive compounds through exchange with the atmosphere. We also take water samples”, the engineer added. These samples provide information on potential pollution from radioactive isotopes released into the atmosphere in the form of waste liquids or gases. Specialists call them bioindicators. These biological compounds indicate the presence or absence of contamination.

Samples are never taken at random on the ground. Analyses are conducted upstream and downstream of nuclear power plants and then compared to evaluate the impact of the effluent releases. The choice of samples depends on the radioactive isotopes being searched for. The experts must take account of the accumulation capacity of each bioindicator. “Since we entered the era of nuclear power it has become difficult to differentiate between natural radioactive isotopes and those connected with human activity, because some of these compounds are already present in the environment”, Isabelle Deniau explains.

Up-to-date knowledge of the behavior of radioactive elements in the areas studied is vital, since the compounds differ depending on the environment in which they have accumulated. Cesium, for example, is a typical compound of nuclear activity which is deposited among sediments in watercourses. It can be transmitted to algae and then consumed by fish and eventually accumulates in their muscles. “In these cases, it is no longer the physical half-life which interests us, but the biological half-life”.


Secure and monitored demolition

These measurements are effective for nuclear power stations in operation, but such sites only have a limited life-span. They have been designed to last for between 25 and 40 years, although this period has been extended over the past few years thanks to advances in knowledge and techniques which ensure the safety of these infrastructures. But a time will come when these power stations will have to be demolished. Measurements are taken by the team at SMART. “Regarding the problem of demolition, our aim might be to determine the level of radioactivity of demolition waste which will later be sent to the ANDRA (National Agency for the Treatment of Radioactive Waste), or to check that no radioactivity remains on the site”, says Isabelle Deniau.

The rehabilitation approach for each of these potentially dangerous sites is taken very seriously at every stage of the process. Before demolition, the experts evaluate the radioactivity of the waste which will be produced. After the demolition, they measure the level of residual radioactivity. “We can also act as third-party experts on demolition sites such as Fort de Vaujours. This constitutes an additional control”.


Reputed and award-winning practices

“We are accredited for samples and analyses by COFRAC, an organization that accredits laboratories and certifies their measures. This provides a guarantee that the results follow a standardized procedure and that the samples and measurement techniques have been validated. This means that if we repeat the measurement, our result will always be the same. We undergo regular audits for this certification”, explains Isabelle Deniau.

Samples for radioactivity analyses are standardized by vital measurement constraints. In the case of water samples, for example, scientists must take samples from the middle of the watercourse and not from zones where the water is stagnant. Certain precautions must also be taken, such as rinsing the vials with sample water, or filling them right to the brim to prevent gas exchange. These precautions are all necessary for reliable and representative results.

“COFRAC certification is reassuring for our clients. It certifies the reliability and quality of our work”, Isabelle Deniau adds. It is important to have an independent actor like SMART. The fact that it is not associated with the organizations producing radioactivity means it can carry out safety measurements without bias. The service adheres to strict regulations that guarantee objective results, and therefore plays an essential role on a societal level.


[1] SUBATECH is a research laboratory co-operated by IMT Atlantique, the Institut National de Physique Nucléaire et de Physique des Particules (IN2P3) of CNRS, and the Université de Nantes.

Fine particulate matter pollution peaks, Véronique Riffautl, IMT Lille Douai

Particulate matter pollution peaks: detection and prevention

By Véronique Riffault, Professor of Atmospheric Sciences, IMT Lille Douai – Institut Mines-Télécom
This article was originally published in French in The Conversation France.

[divider style=”normal” top=”5″ bottom=”5″]


This winter, France and a large part of Europe were struck by episodes of particulate matter pollution. These microscopic particles are known as PM2.5 and PM10 when they measure less than 2.5 or 10 micrometers (µm) in diameter respectively.

They are proven to be harmful to human health because they enter our respiratory system, and the smallest can even enter our blood flow. According to the European Environment Agency, air pollution is the cause of 467,000 premature deaths annually in Europe.

These particles can come from natural sources (sea salt, volcanic eruptions, forest fires etc.) or human activities (transport, heating, industry etc.)


What is a pollution peak?

Pollution peaks occur when regulatory warning thresholds, as defined in 2008 by the European Union and transposed to French law in late 2010, are exceeded.

In virtue of these regulations, the first level of severity (known as the “public information and warning threshold”) is reached for PM10 particles when there are ≥50 µg per cubic meter of air (m³) in the atmosphere; the warning level is reached at ≥80 µg/m³.

There is no trigger limit for PM2.5, but just a set maximum amount of 25 µg/m³ on average per year.

However, these regulations have serious limitations. The “mass” concentration thresholds which indicate the total mass of particles in the air and which are used to assess the danger of particulate matter pollution are higher than the levels recommended by the WHO, which have been set for PM10 at 20 µg/m³ on average per year and 50 µg/m³ on average per day, in order to take account of chronic and short-term exposure.

In addition, the only parameter taken into account in European and French regulations concerns mass concentration. The concentration in terms of number (i.e. the number of particles per m³ of air), and the chemical composition are not taken into account for the triggering of warnings.

Lastly, there are no regulations for very small particulate matter (less than 1 µm), which is mainly produced by human activity, even though it is potentially the most harmful.


Comparison of the size of microscopic particles with a hair and grain of sand. US-EPA


How are they detected?

In France, the Ministry for the Environment has delegated the task of monitoring air quality and regulated pollutants across the country to certified associations united under Fédération Atmo France. They are supported in this task by the Central Laboratory for the Monitoring of Air Quality.

These associations put in place automatic measurements for the concentration of pollutants, as well as other monitoring measures to allow a better understanding of the phenomena observed, such as the chemical composition of particles, or weather conditions.

These measurements can be combined with approaches for modeling particle concentration, thanks in particular to Prevair, the French forecast platform. Calculating the history of air mass can also be used to reveal the origin of particles, and it is therefore now possible to describe the phenomena at the origin of the increase in concentrations in relative detail.


Explanation of a real case

The graph below, produced from observations by our research department and measurements by Atmo Hauts-de-France, illustrates an example of pollution peaks that affected the local area in January 2017.

During this period, anticyclonic weather conditions contributed to the stagnation of air masses above pollutant-emitting areas. In addition, cooler temperatures led to an increase in emissions (notably linked to domestic wood heating) and the formation of “secondary” particles which formed after chemical reactions in the atmosphere.

Data V. Riffault/SAGE (Cappa and Climibio projects), CC BY-NC-ND


The graphs show changes in mass concentrations of PM10 and PM2.5 over a period of several days at the Lille Fives monitoring station, as well as changes in several chemical species measured in PM1 4 km away on the University of Lille campus.

We can see that almost all the particles fell within the PM2,5 proportion, something which rules out natural phenomena such as a dust being blown in from deserts, since such particles mainly fall within the range of 2.5 to 10 µm. Furthermore, the particles in question are generally smaller in size than 1 µm.

The pollution episode began on the evening of Friday January 21 and continued throughout weekend, in spite of a lower level of road traffic. This can be explained by an increase in wood burning (as suggested by the m/z 60 tracer, which is a fragment of levoglucosan, a molecule emitted by pyrolysis of cellulose found in wood).

Wood burning and other forms of combustion (such as traffic or certain industries) also emit nitrogen dioxide (NO2) as a gas, which can turn into nitric acid (HNO3) through a reaction with hydroxyl radicals (•OH) in the atmosphere.

At sufficiently low temperatures, HNO3 combines with ammonia (NH3) produced by farming activity to form ammonium nitrate (NH4NO3) solid. These are known as “secondary particles”.

A slight decrease in concentrations of particulate matter was observed at the end of the weekend, with more favorable weather conditions for the dispersion and elimination of pollutants.

In this episode, the very low concentrations of sulfates rule out an impact from coal power stations in Germany and Eastern Europe. It is therefore definitely a question of local and regional pollution linked to human activity and which accumulated as a result of unfavorable weather conditions.


How can this be avoided?

Since we cannot control the weather conditions, levers of action are primarily based on reducing pollutant emissions.

For example, reducing the formation of secondary particles will entail limiting NO2 emissions linked to road traffic through road space rationing measures; for NH3 emissions, action must be taken regarding farming practices (spreading and rearing methods).

Concerning emissions from wood heating, replacing older devices with cleaner ones will enable better burning and fewer particulate matter emissions; this could be accompanied by an investment in housing insulation.

But these measures should not make us forget populations’ chronic exposure to concentrations of particulate matter which exceed the recommended WHO thresholds. This type of pollution is insidious and is damaging to health in the medium and long term, notably with the development of cardio-vascular and respiratory diseases and lung cancer.