MANIFESTS

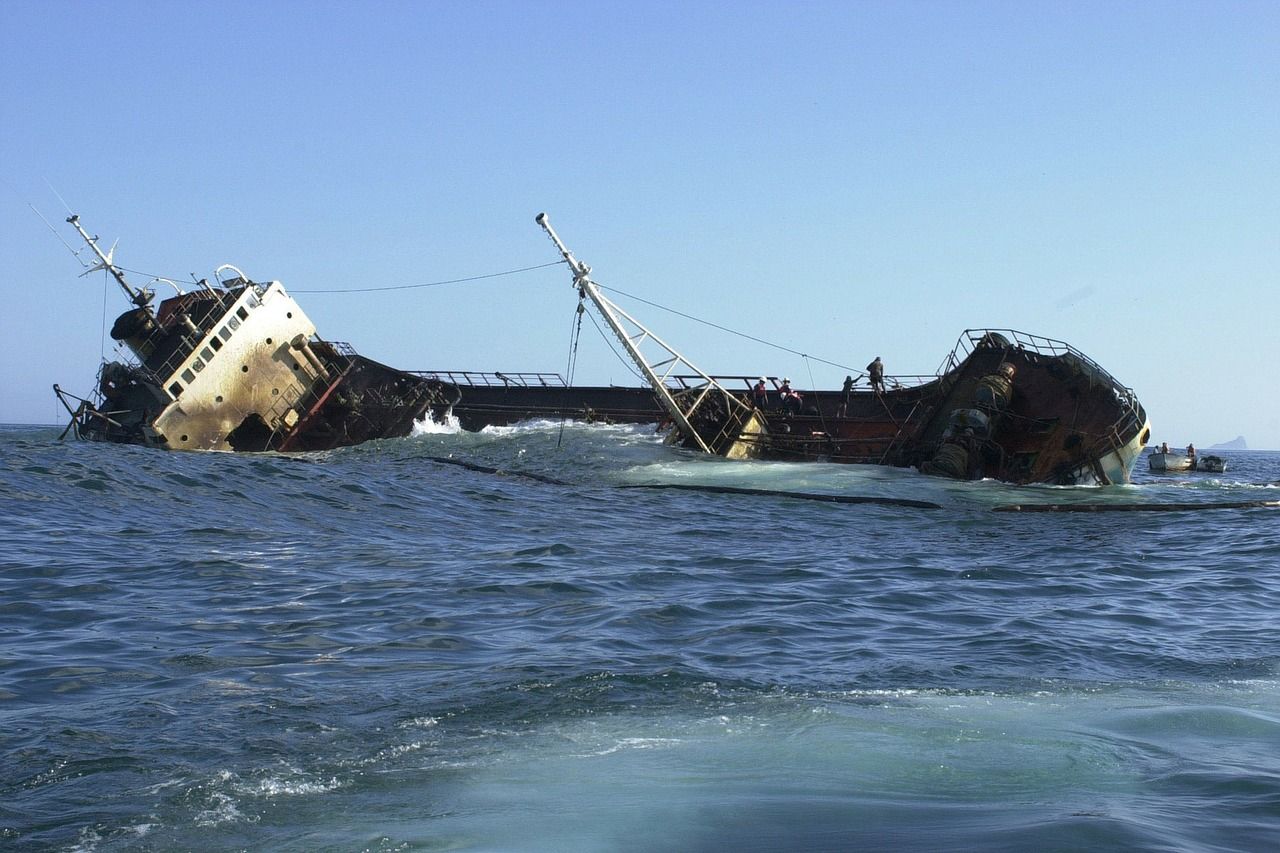
Decision support tools for maritime accident management

The European MANIFESTS project, launched in January, is a two-year project bringing together a consortium of nine research institutions and public administrations with complementary expertise in managing maritime accidents. Funded by the European Commission, this project aims to improve responses to emergencies related to these accidents. An interview with Laurent Aprin, a researcher at IMT Mines Alès, a project partner.

Could you describe the broader context of the MANIFESTS project?

Laurent Aprin –The MANIFESTS project (Managing Risks and Impacts From Evaporating and Gaseous Substances to Population Safety) is a follow-up to the European HNS-MS project funded from 2015 to 2017 by the European Commission’s Directorate General for European Civil Protection and Humanitarian Aid (DG-ECHO). The purpose of this project was to study and model the consequences of chemical spills in the ocean and determine the vulnerability of the environment, people and goods depending on the chemicals spilled. We wanted to continue our research by expanding the consortium and addressing questions submitted by the various stakeholders at the end-of-project meeting, in particular the consequences of evaporating substances that are likely to form toxic clouds, which are flammable, or even explosive.

What is the aim of the MANIFESTS project?
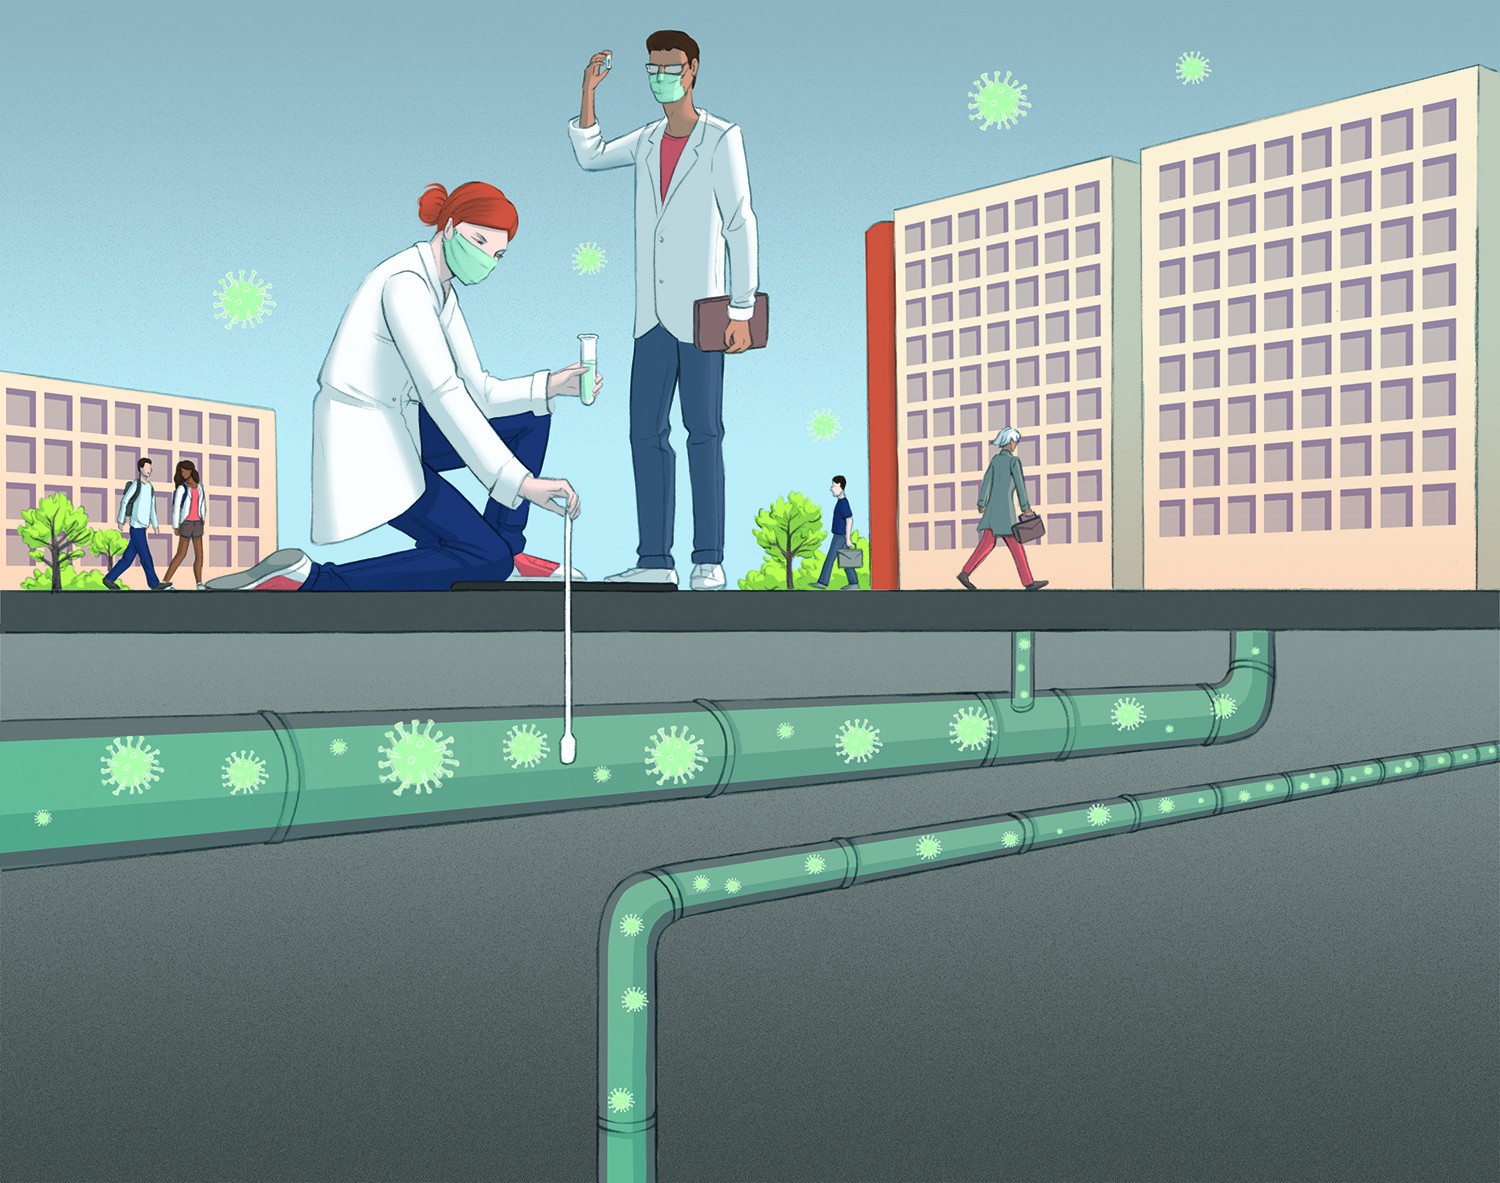
LA ­– Responding to maritime accidents can be especially challenging when they involve Hazardous and Noxious Substances (HNS) which act like gases or evaporators. Due to their potential to form toxic or combustible clouds, fact-based decisions are needed to protect the crew, responders, coastal communities and the environment. But when an accident is declared, key information for assessing risks for responders or emergency teams is not always available. Allowing a ship that presents a risk to dock in a place of refuge due to a lack of knowledge and data could have major implications for coastal communities. The aim of MANIFESTS is to respond to these uncertainties and improve response capacity with decision support tools and novel and innovative operational guidelines. How so? By facilitating access to knowledge and databases, all of which are hosted on a dedicated open source web platform accessible to planners and responders.

How will you achieve this goal?

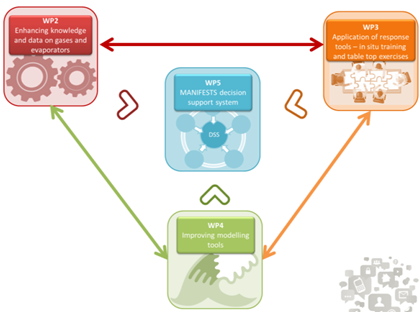
LA – The MANIFESTS project is divided into four activities (workpackages, WP) supported by two cross-project activities, project management (WP1) and project communication (WP6). The technical work includes producing new data and knowledge on gases and evaporating substances that may be released during marine accidents. This information will be obtained by acquiring knowledge from the literature and research data (WP2). WP3 involves developing methods to assess and manage risks and testing response tools through computer-based and field trials. WP4 will focus on developing and improving tools for modeling HNS behavior and developing a MANIFESTS decision support system. This WP includes developing  new tools based on the previously described WPs and upgrading the models developed in the existing HNS-MS and MARINER projects (WP5).

L’attribut alt de cette image est vide, son nom de fichier est image.png.

What scientific expertise are IMT Mines Alès researchers bringing to this project?

LA – IMT Mines Alès[1] researchers are primarily involved in two WPs:

  • WP2: improving knowledge and data on gases and evaporating substances for which IMT Mines Alès is the coordinator. This task aims to characterize and theoretically and experimentally assess the behavior and impacts of HNS when they are released into the ocean, with a particular focus on the release of volatile substances that may lead to the formation of a potentially toxic, flammable and/or explosive gas cloud.
  • WP6: strategy for dissemination, exploitation and visibility, in particular to develop proof of concept (PoC) for a serious games to train emergency responders and planners involved in managing marine pollution events. Using an immersive scenario, this crisis simulation makes it possible to test the implementation of response plans, the response cell’s capacity to fulfill its missions (including adapting during a dynamically evolving scenario) and to make defensible decisions under demanding, realistic conditions.

Who are your partners for this project and how are you working together?

LA – The project consortium is coordinated by Cedre (France)[2], and includes 9 research institutions and public administrations from 6 countries (France, Belgium, UK, Norway, Spain, Portugal) with strong complementary expertise: ARMINES/IMT Mines Alès (France), Royal Belgium Institute of Natural Science (RBINS, Belgium), Instituto Tecnológico para el Control del Medio Marino de Galicia (INTECMAR, Spain), Centro tecnologico del mar/Fundacion CETMAR (Spain), Instituto superior tecnico (Portugal), Department of Health (UK), Meteorologisk Institutt (Norway) and the Federal Public Service for Public Health, Food Chain Safety and Environment (Belgium). They are involved in all the aspects of marine pollution addressed by the project: chemical analysis, pollution modeling, developing decision support tools, risk assessment and management, training and exercises, knowledge transfer. MANIFESTS will also benefit from collaboration with an advisory committee comprising 6 national maritime authorities who will be the primary end-users of the project results, including the French Navy, CEPPOL (Centre of Practical Expertise for Pollution Response) and customs for France.

What are the next big steps for the project?

LA – The MANIFESTS project was launched on 1 January 20201 and is set to run for two years. The first phase will involve an accident study and a literature review of the modeling of the behavior of evaporating substances in the ocean. The next steps will focus on creating experimental designs to characterize the  evaporation rate of substances and the consequences of explosions, programming consequence models (dispersion, fire and explosion) and conducting a large-scale trial in the Atlantic Ocean.


[1] The IMT Mines Alès team includes Laurent Aprin, Aurélia Bony-Dandrieux, Philippe Bouillet, Frédéric Heymes, Christian Lopez and Jérôme Tixier.

[2] Laura Cotte, engineer, and Stéphane Le Floch, Head of the Research Department at the Centre for Documentation, Research and Experimentation on Accidental Water Pollution (Cedre), are the initiators and coordinators of the project.

Interview by Véronique Charlet

Sobriété numérique, digital sobriety

What is digital sufficiency?

Digital consumption doubles every 5 years. This is due in particular to the growing number of digital devices and their increased use. This consumption also has an increasing impact on the environment. Digital sufficiency refers to finding the right balance for the use of digital technology in relation to the planet and its inhabitants. Fabrice Flipo, a researcher at Institut Mines-Télécom Business School and the author of the book “L’impératif de la sobriété numérique” (The Imperative of Digital Sufficiency) explains the issues relating to this sufficiency.

What observation is the concept of digital sufficiency based on?

Fabrice Flipo: On the observation of our increasing consumption of digital technology and its impacts on the environment, especially in terms of greenhouse gases. This impact is due to the growing use of digital tools and their manufacturing. Materials for digital tools depend on their extraction, which relies primarily on fossil fuels, and therefore carbon. The use of these tools is also increasingly energy-intensive.

The goal is to include digital technology in discussions currently underway in other sectors, such as energy or transportation. Until recently, digital technology has been left out of these debates. This is the end of the digital exception.

How can we calculate the environmental impacts of digital technology?

FF: The government’s roadmap for digital technology primarily addresses the manufacturing of digital tools, which it indicates accounts for 75% of its impacts. According to this roadmap, the solution is to extend the lifespan of digital tools and combat planned obsolescence. But that’s not enough, especially since digital devices have proliferated in all infrastructure and their use is increasingly costly in energy. The amount of data consumed doubles every 5 years or so and the carbon footprint of the industry has doubled in 15 years.  

It’s hard to compare figures about digital technology because they don’t all measure the same thing. For example, what should we count in order to measure internet consumption? The number of devices, the number of individual uses, the type of uses? So standardization work is needed.

A device such as a smartphone is used for many purposes. Consumption estimations are averages based on typical use scenarios. Another standardization issue is making indicators understandable for everyone. For example, what measurements should be taken into account to evaluate environmental impact?

What are the main energy-intensive uses of digital technology?

FF: Today, video is one of the uses that consumes the most energy. What matters is the size of the files and their being transmitted in computers and networks. Every time they are transmitted, energy is consumed. Video, especially high-resolution video, commands pixels to be switched on up to 60 times per second. The size of the files makes their transmission and processing very energy-intensive. This is the case for artificial intelligent programs that process images and video as well. Autonomous vehicles are also likely to use a lot of energy in the future, since they involve huge amounts of information. 

What are the mechanisms underlying the growth of digital technology?

FF: Big companies are investing heavily in this area. They use traditional marketing strategies: target an audience that is particularly receptive to arguments and able to pay, then gradually expand this audience and find new market opportunities. The widespread use of a device and a practice leads to a gradual phasing out of alternative physical methods. When digital technology starts to take hold in a certain area, it often ends up becoming a necessary part of our everyday lives, and is then hard to avoid. This is referred to as the “lock-in” effect. A device is first considered to be of little use, but then becomes indispensable. For example, the adoption of smartphones was largely facilitated by offers funded by charging other users, through the sale of SMS messages. This helped lower the market entry cost for the earliest adopters of smartphones and create economies of scale. Smartphones then became widespread. Now, it is hard to do without one.

How can we apply digital sufficiency to our lifestyles?

FF: Sufficiency is not simply a matter of “small acts”, but it cannot be enforced by a decree either. The idea is to bring social mindedness to our lifestyles, to regain power over the way we live. The balance of power is highly asymmetrical: on one side are the current or potential users who are scattered, and on the other are salespeople who tout only the advantages of their products and have extensive resources for research and for attracting customers. This skewed balance of power must be shifted. An important aspect is informing consumers’ choices. When we use digital devices today, we have no idea about how much energy we’re consuming or our environmental impact: we simply click. The aim is to make this information perceptible at every level, and to make it a public issue, something everyone’s concerned about. Collective intelligence must be called upon to change our lifestyles and reduce our use of digital technology, with help from laws if necessary.

For example, we could require manufacturers to obtain marketing authorization, as is required for medications. Before marketing a product or service (a new smartphone or 5G), the manufacturer or operator would have to provide figures for the social-ecological trajectory they seek to produce, through their investment strategy. This information would be widely disseminated and would allow consumers to understand what they are signing up for, collectively, when they choose 5G or a smartphone. That is what it means to be socially-minded: to realize that the isolated act of purchasing actually forms a system.

Today, this kind of analysis is carried out by certain associations or non-governmental organizations. For example, this is what The Shift Project does for free. The goal is therefore to transfer this responsibility and its cost to economic players who have far greater resources to put these kinds of analyses in place. Files including these analyses would then be submitted to impartial public organizations, who would decide whether or not a product or service may be marketed. The organizations that currently make such decisions are not impartial since they base their decisions on economic criteria and are stakeholders in the market that is seeking to expand.  

How can sufficiency be extended to a globalized digital market?  

FF: It works through a leverage effect: when a new regulation is established in one country, it helps give more weight to collectives that are dealing with the same topic in other countries. For example, when the electronic waste regulation was introduced, many institutions protested. But gradually, an increasing number of  countries have adopted this regulation.

Some argue that individual efforts suffice to improve the situation, while others think that the entire system must be changed through regulations. We must get away from such either-or reasoning and go beyond  opposing viewpoints in order to combine them. The two approaches are not exclusive and must be pursued simultaneously.

By Antonin Counillon

données de santé, health data

Speaking the language of health data to improve its use

The world of healthcare has extensive databases that are just waiting to be used. This is one of the issues Benjamin Dalmas, a data science researcher at Mines Saint-Étienne, is exploring in his work. His main objective is to understand the origin of this data to use it more effectively. As such, he is working with players from the public and private sectors for analysis and predictive purposes in order to improve management of health care institutions and our understanding of care pathways.

Research has made great strides in processing methods using machine learning. But what do we really know about the information that such methods use? Benjamin Dalmas is a health data science researcher at Mines Saint-Étienne. The central focus of his work is understanding health data, from its creation to its storage. What does this data include? Information such as the time of a patient’s arrival and discharge, exams carried out, practitioners consulted etc. This data is typically used for administrative and financial purposes.

Benjamin Dalmas’s research involves identifying and finding a straightforward way to present relevant information to respond to the concrete needs of public and private healthcare stakeholders. How can the number of beds in a hospital ward be optimized? Is it possible to predict the flow of arrivals in an emergency room? The responses to these problems rely on the same information: the medical administrative data produced every day by hospitals to monitor their patient pathways.

However, depending on the way in which it is considered, the same data can provide different information. It is the key witness to several investigations. So it must be approached in the right way to get answers.

Understanding data in order to prevent bias

Since it is primarily generated by humans, health data may be incorrect or biased. By focusing on its creation, researchers seek to identify the earliest potential bias. Benjamin Dalmas is working with Saint-Étienne University Hospital Center to study the codes assigned by the hospital upon a patient’s discharge. These codes summarize the reason for which the individual came to the hospital and received care. Doctors who specialize in this coding generate up to 16,000 different codes, a tedious task, for which the hospital wishes to seek assistance from a decision support tool to limit errors. “That means we must understand how humans code. By analyzing large quantities of data, we identify recurring errors and where they come from, and we can solve them,” explains Benjamin Dalmas. Greater accuracy means direct economic benefits for the institution.

However, this mass-produced data is increasingly used for other purposes than reimbursing hospitals. For the researcher, it is important to keep in mind that the data was not created for these new analyses. For example, he has noticed that such a straightforward notion as time may hide a number of different realities. When a consultation time is specified, it may mean one of three things: the actual time of consultation, the time at which the information was integrated in the file, or a time assigned by default. Since the primary objective of this information is administrative, the consultation time does not have a lot of importance. “If we don’t take the time to study this information, we run the risk of making biased recommendations that are not valid. Good tools cannot be created without understanding the data that fuels them,” says the researcher. Without this information, for example, a study focusing on whether or not social inequalities exist and taking into account how long a patient must wait before receiving care, could draw incorrect conclusions.

From reactive to proactive

So researchers must understand the data, but for what purpose? To predict, in order to anticipate, rather than just react. The development of predictive tools is the focus of a collaboration between Mines Saint-Étienne researchers and the company Move in Med. The goal is to anticipate the coordination of care pathways for breast cancer patients. In the case of chronic diseases such as cancer, the patient pathway is not limited to the hospital but also depends on a patient’s family, associations etc. To this end, the researchers are cross-referencing medical data with other social information (age, marital status, socio-economic background, place of residence etc.). Their aim is to identify unexpected factors, in the same way in which the weather, air quality and the even the occurrence of cultural events impact periods of peak arrival in emergency rooms. Predicting the complexity of a care pathway allows the company to allocate the appropriate resources and therefore ensure better care.

At the same time, the Auvergne Rhône-Alpes Regional Health Agency has been working with the researchers since May 2020 to predict hospital capacity strain levels for Covid arrivals. By reporting visual data based on systems of colors and arrows, the researchers provide information about changing dynamics and levels of hospital capacity strain in the region (Covid patient arrivals, positive PCR tests in the region, number of available beds etc.) In this work, researchers are tackling monitoring trends. How are these parameters evolving over time? At what threshold values do they alert the authorities that the situation is getting worse? To answer these questions, the research team provides maps and projections that the health agency can use to anticipate saturation and therefore prevent institutions from becoming overwhelmed, arrange for patients to be transferred etc.

Finding the right balance between volume and representativeness

The study of data raises questions about volume and representativeness, which depend on the user’s request. Proving without equipping oneself requires more data in order to fuel machine learning algorithms. “However, recovering public health data is quite an ordeal. We have to follow protocols that are highly regulated by the CNIL (the French Data Protection Authority) and ethics committees to justify the volume of data requested,” explains Benjamin Dalmas. On the other hand, a request for operational tools must be able to adapt to the on-the-ground realities faced by practitioners. That means working with limited amounts of information. It is a matter of finding the right balance.  

The Mines Saint-Étienne researchers are working with the Saint-Étienne-based company MJ INNOV on these aspects. The company offers an interactive facilitation tool to improve quality of life for individuals with cognitive impairments. Based on videos and sounds recorded during the stages of play, this research seeks to identify the impact of the practice on various subjects (nursing home residents, persons with Alzheimer’s disease etc.). In addition to using the information contained in residents’ files, this involves collecting a limited quantity of new information. “In an ideal world, we would have 360° images and perfect sound coverage. But in practice, to avoid disturbing the game, we have to plan on placing microphones under the table the patients are playing on, or fitting the camera directly within the inside of the table. Working with these constraints makes our analysis even more interesting,” says Benjamin Dalmas.

Measuring the impact of healthcare decision support tools

In the best-case scenario, researchers successfully create a decision support tool that is accessible online. But is the tool always adopted by the interested parties? “There are very few studies on the ergonomics of tools delivered to users and therefore on their impact and actual use,” says Benjamin Dalmas. Yet, this is a crucial question in his opinion, if we seek to improve data science research in such a concrete area of application as healthcare.  

To this end, an appropriate solution often means simplicity. First of all, by being easy-to-read: color schemes, shapes, arrows etc. Visualization and interpretation of data must be intuitive. Second, by promoting explainability of results. One of the drawbacks of machine learning is that the information provided seems to come from a black box. “Research efforts must now focus on the presentation of results, by enhancing communication between researchers and users,” concludes Benjamin Dalmas.

By Anaïs Culot

Read more on I’MTech: When AI helps predict a patient’s care pathway

réseaux optiques, optical networks

The virtualization of optical networks to support… 5G

Mobile networks are not entirely wireless. They also rely on a network of optical fibers, which connect antennas to the core network, among other things. With the arrival of 5G, optical networks must be able to keep up with the ramping up of the rest of the mobile network to ensure the promised quality of service. Two IMT Atlantique researchers are working on this issue, by making optical networks smarter and more flexible.  

In discussions of issues surrounding 5G, it is common to hear about the installation of a large number of antennas or the need for compatible devices. But we often overlook a crucial aspect of mobile networks: the fiber optic infrastructure on which they rely. Like previous generations, 5G relies on a wired connection in most cases. This technology is also used in the “last mile”. It therefore makes it possible to connect antennas to core network equipment, which is linked to most of the connected machines around the world. It can also connect various devices within the same antenna site.

In reality, 5G is even more dependent on this infrastructure than previous generations since the next-generation technology comes with new requirements related to new uses, such as the Internet of Things (IoT). For example, an application such as an autonomous car requires high availability, perfect reliability, very-low latency etc. All of these constraints weigh on the overall architecture, which includes fiber optics. If they cannot adapt to new demands within the last mile, the promises of 5G will be jeopardized. And new services (industry 4.0, connected cities, telesurgery etc.) will simply not be able to be provided in a reliable, secure way.

Facilitating network management through better interoperability

Today, optical networks are usually over-provizioned in relation to current average throughput needs. They are designed to be able to absorb 4G peak loads and are neither optimized, nor able to adapt intelligently to fluctuating demand. The new reality created by 5G, therefore represents both a threat for infrastructure in terms of its ability to respond to new challenges, and an opportunity to rethink its management.

Isabel Amigo and Luiz Anet Neto, telecommunications researchers at IMT Atlantique, are working with a team of researchers and PhD students to conduct research in this area. Their goal is to make optical networks smarter, more flexible and more independent from the proprietary systems imposed by vendors. A growing number of operators are moving in this direction. “At Orange, it used to be common to meet specialists in configuration syntaxes and equipment management for just one or two vendors,” explains Luiz Anet Neto, who worked for the French group for five years. “Now, teams are starting to set up a “translation layer” that turns the various configurations, which are specific to each vendor, into a common language that is more straightforward and abstract.”

This “translation layer”, on which he is working with other researchers, is called SDN, which stands for Software-Defined Networking. This model is already used in the wireless part of the network and involves offloading certain functions of network equipment. Traditionally, this equipment fulfills many missions: data processing (receiving and sending packets back to their destination), as well as a number of control tasks (routing protocols, transmission interfaces etc.) With SDN, equipment is relieved from these control tasks, which are centralized within an “orchestrator” entity that can control several devices at once.  

Read more on I’MTech: What is SDN?

There are many benefits to this approach. It provides an overview of the network, making it easier to manage, while making it possible to control all of the equipment, regardless of its vendor without having to know any proprietary language. “To understand the benefit of SDN, we can use an analogy between a personal computer and the SDN paradigm,” says Isabel Amigo. “Today, it would be unthinkable to have a computer that would only run applications that use a specific language. So, machines have an additional layer – the operating system – that is in charge of “translating” the various languages, as well as managing resources, memory, disks etc. SDN therefore aims to act like an operating system, but for the network.” Similarly, the goal is to be able to install applications that are able to work on any equipment, regardless of the hardware vendor. These applications could, for example, distribute the load based on demand.

Breaking our dependence on hardware vendors

SDN often goes hand in hand with another concept, inspired by virtualization in data centers: NFV (Network Functions Virtualization). Its principle: being able to execute any network functionality (not just control functions) on generic servers via software applications.”Usually, dedicated equipment is required for these functions,” says the IMT researcher. “For example, if you want to have a firewall, you need to buy a specific device from a vendor. With NFV, this is no longer necessary: you can implement the function on any server via an application.”

Read more on I’MTech: What is NFV?

As with SDN, the arrival of virtualization in optical networks promotes better interoperability. This makes it harder for vendors to require the use of their proprietary systems linked to their equipment. The market is also changing, by making more room for software developers. “But there is still a long way to go,” says Luiz Anet Neto. “Software providers can also try to make their customers dependent on their products, through closed systems. So operators have to remain vigilant and offer an increasing level of interoperability.”

Operators are working with the academic world precisely for this purpose. They would fully benefit from standardization, which would simplify the management of their optical networks. Laboratory tests carried out by IMT Atlantique in partnership with Orange provide them with technical information and areas to explore ahead of discussions with vendors and standardization bodies.

Sights are already set on 6G

For the research teams, there are many areas for development. First of all, the scientists are seeking to further demonstrate the value of their research, through testing focusing on a specific 5G service (up to now, the experiments have not applied to a specific application). Their aim is to establish recommendations for optical link dimensioning to connect mobile network equipment.

The goal is then to move towards smart optimization of optical networks. To provide an example of how findings by IMT Atlantique researchers may be applied, it is currently possible to add a “probe” that can determine if a path is overloaded and shift certain services to another link if necessary. The idea would then be to develop more in-depth mathematical modeling of the phenomena encountered, in order to automate incident resolution using artificial intelligence algorithms.

And it is already time for researchers to look toward the future of technology. “Mobile networks are upgraded at a dizzying pace; new generations come out every ten years,” says Luiz Anet Neto. “So we already have to be thinking about how to meet future requirements for 6G!

Bastien Contreras

Projet MAESTRIA AVC

A European consortium for early detection of stroke and atrial fibrillation

The European project MAESTRIA, launched in March 2021 and set to run 5 years, will take on the major challenges of data integration and personalized medicine with the aim of preventing heart rhythm problems and stroke. How? By using artificial intelligence approaches to create multi-parametric digital tools. Led by Sorbonne University and funded by the European Union to the tune of €14 million, the project brings together European, English, Canadian and American partners. An interview with Anne-Sophie Taillandier, Director of Teralab, IMT’s Big Data and AI platform, which is a member of the consortium.   

In what health context was the MAESTRIA developed?

Anne-Sophie Taillandier – Atrial fibrillation (AF), heart rhythm disorder and stroke are major health problems in Europe. Most often, they are the clinical expression of atrial cardiomyopathy, which is under-recognized due to a lack of specific diagnostic tools.

What is the aim of MAESTRIA?

AST  MAESTRIA (for Machine Learning Artificial Intelligence for Early Detection of Stroke and Atrial Fibrillation) aims to prevent the risks associated with atrial fibrillation in order to ensure healthy ageing in the European population. Multidisciplinary research and stratified approaches (involving adapting  a patient’s treatment depending on his/her biological characteristics) are needed to diagnose and treat AF and stroke.

What technologies will be deployed?

AST  “Digital twin” technologies, a powerful data integrator combining biophysics and AI, will be used to generate virtual twins of human heart atria using patient-specific data.

MAESTRIA will create digital multi-parametric digital tools based on a new generation of biomarkers that integrate artificial intelligence (AI) and big data from cutting-edge imaging, electrocardiography and omics technologies (including physiological responses modulated by individual susceptibility and lifestyle factors). Diagnostic tools and personalized therapies for atrial cardiomyopathy will be developed.

Unique experimental large-animal models, ongoing patient cohorts and a prospective cohort of MAESTRIA patients will provide rigorous validation of the new biomarkers and tools developed. A dedicated central laboratory will collect and harmonize clinical data. MAESTRIA will be organized as a user-centered platform that is easily accessible via clinical parameters commonly used in European hospitals.

What is the role of Teralab, IMT’s Big Data and AI platform?

AST – The TeraLab team, led by Natalie Cernecka and Luis Pineda, is playing a central role in this project, in three ways. First of all, TeraLab will be involved in making heterogeneous, sensitive health data available for the consortium, while ensuring legal compatibility and security.

Second, TeraLab will build and manage the data hub for the project data, and make this data available to the team of researchers so that they can aggregate and analyze it, and then build a results demonstrator for doctors and patients.

And last but not least, TeraLab will oversee the data management plan or DMP, an essential part of the management of any European project. It is a living document that sets out a plan for managing the data used and generated within the framework of the project. Initiated at the start of the project, this plan is updated periodically to make sure that it still appropriate in light of how the project is progressing. It is even more necessary when it’s a matter of health data management.

Who are the partners for MAESTRIA ?

AST – MAESTRIA is a European consortium of 18 clinicians, scientists and pharmaceutical industry representatives, at the cutting edge of research and medical care for AF and stroke patients. A scientific advisory board including potential clinician users will help MAESTRIA respond to clinical and market needs.

It’s an international project, focused on the EU countries, but certain partners come from England, Canada and the United States. Oxford University, for example, has developed interesting solutions for the processing and aggregation of cardiological data. It is a member of the consortium and we will, of course, be working with its researchers.

We have important French partners such as AP-HP (Assistance Publique-Hôpitaux de Paris, Paris Hospital Authority) involved in data routing and management. The project is coordinated by Sorbonne University.

What are the next big steps for the project?

AST – The MAESTRIA has just been launched, the first big step is making the data available and establishing the legal framework.

Because the data used in this project is heterogeneous – hence the importance of aggregating it – we must understand the specific characteristics of each kind of data (human data, animal data, images, medical files etc.) and adapt our workspaces to users. Since this data is sensitive, security and confidentially challenges are paramount.

Learn more about MAESTRIA

Interview by Véronique Charlet

Data visualization

Understanding data by touching it

Reading and understanding data is not always a simple task. To make it easier, Samuel Huron is developing tools that allow us to handle data physically. The Télécom Paris researcher in data visualization and representation seeks to make complex information understandable to the general public.

Before numbers were used, merchants used clay tokens to perform mathematical operations. These tokens allowed them to represent numerical data in a graphical, physical way, and handle it easily. This kind of token is still used in schools today to help young children become familiar with complex concepts like addition and cardinality. “This very simple tool can open the door to highly complex representations, such as the production of algorithms,” says Samuel Huron, a researcher at Télécom Paris in the fields of data visualization and interactive design.

His work aims to use this kind of simple representation tool to make data understandable to non-experts. “The best way to visualize data is currently programming, but not all of us are computer engineers,” says Samuel Huron. And while providing the entire population with training in programming may be a commendable idea, it is not very realistic. This means that we must trust experts who, despite their best intentions, may provide a subjective interpretation of their observation data.

In an effort to find an alternative, the researcher has taken up the idea of clay tokens. He organizes workshops for people with little or no familiarity with handling data, and proposes using tokens to represent a data set. For example, to represent their monthly budget. Once they have the tokens in their hands, the participants must invent graphical models to represent this data based on what they want to get out of it. “One of the difficult and fundamental things in graphical data analysis is choosing the useful representation for the task, and therefore targeting the visual variables to understand your batch of data,” explains Samuel Huron. “The goal is to teach the participants the concept of visual mapping.”

Video: how does physical representation of data work:

The visualization is not only intended to represent this data, but to develop the capacity to read and make sense of it. Participants must find a way to structure the data themselves. They are then encouraged to think critically by observing the other productions, in particular to see whether they can be read and understood. “In certain workshops with many different data sets, such as the budget of a student, an employed individual, or a retiree, participants can sometimes identify a similar profile just by looking at the representations of other participants,” adds the researcher.

Citizen empowerment 

This transmission method poses real challenges for democracy in our era of digitization of knowledge and the rise of data. To understand the important issues of today and respond to the major challenges we face, we must first understand the data from various fields.  Whether related to budgets, percentage of votes, home energy consumption, or the daily number of Covid-19 cases, all of this knowledge and information is provided in the form of data, either raw or processed to some extent. And to avoid dealing with abstract figures and data, it is represented visually.  Graphs, curves and other diagrams are provided to illustrate this data. But these visual representations are not always understandable to everyone. “In a democracy, we need to understand this data in order to make informed decisions,” says Samuel Huron.

Citizen empowerment is based on the power to make decisions, taking into account complex issues such as climate change or the national budget breakdown. Likewise, to tackle the coronavirus, an understanding of data is required in order to assess risk and implement health measures of varying strictness. It was this societal issue that pushed Samuel Huron to look for data visualization methods that can be used by everyone, with a view to data democratization. This approach includes open data policies and transparency, of course, as well as useful and user-friendly tools that allow everyone to understand and handle this data.

Thinking about the tools

“A distinctive characteristic of human beings is producing representations to process our information,”  says the researcher. “The alphabet is one such example: it’s a graphical encoding to store information that other people can find by reading it.”  Humankind has the capacity to analyze images to quickly identify and examine a set of diagrams, without even thinking at times. These cognitive capacities enable operations in visual space that are otherwise very difficult and allow them to be carried out more quickly than with another kind of encoding, such as numbers.

This is why we tend to illustrate data graphically when we need to explain it. But this is time-consuming and graphs must be updated with each new data set. On the virtual side, there is no shortage of software spreadsheet solutions that allow for dynamic, efficient updates. But they have the drawback of limiting creativity. “Software programs like Excel are great, but all of the possible actions are predefined. Expressiveness of thought is limited by the models offered by the tool,”  says Samuel Huron.

Far from considering tokens to be the ideal solution, the researcher says that they are above all a tool for teaching and raising awareness. “Tokens are a very simple format that make it possible to get started quickly with data visualization, but they remain quite limited in terms of representation,” he says. He is working with his colleagues to develop more complicated workshops with larger data sets that are more difficult to interpret.  In general, these workshops also aim to think about ways to promote the use of data physicalization, with more varied tools and data sets, and therefore more diverse representations. Other studies intend to consider the value of the data rather than that resulting from its handling.

By proposing these data physicalization kits, the researchers can study participants’ thinking. They can therefore better understand how individuals understand, format, handle and interpret data. These observations in turn help the researchers improve their tools and develop new ones that are even more intuitive and user-friendly for different groups of individuals. To go further, the researchers are working on a scientific journal devoted to the topic of data physicalization planned for late 2021. It should  assess the state of the art on this topic, and push research in this area even further. Ultimately, this need to understand digital data may give rise to physical tools to help us grasp complex problems – literally. 

By Tiphaine Claveau.

detection covid-19 eaux usées

Covid-19: what could subsurface wave detection mean for the pandemic?

The detection of SARS-CoV-2 viral infections responsible for Covid-19 allows us to monitor the evolution of the pandemic. Most methods are based on individual patient screening, with the disadvantages of cost and time. Other approaches based on the detection of SARS-CoV-2 in urban wastewater have been developed to monitor the trends in infections. Miguel Lopez-Ferber, a researcher at IMT Mines Alès, conducted a study to detect the virus in wastewater on the school’s campus. This precise, small-scale approach allows us to collect information on the probable causes of infection.

How do you detect the presence of Sars-CoV-2 in wastewater?

Miguel-Lopez-Ferber: We use the technique developed by Medema in 2020. After recovering the liquid part of the wastewater samples, we use a centrifugation technique that allows us to isolate a phase that contains the virus-sized particles. From this phase, we proceed with the extraction of the viral genomes present to perform PCR tests. PCR (polymerase chain reaction) is a technique used to amplify a genetic signal. If the PCR amplifies viral genome fragments specific to Sars-CoV-2, then the virus is present in the wastewater sample.

Does this technique tell us the concentration of the virus?

MLF: Yes. Thanks to our partnership with the PHYSE team of the HydroSciences Montpellier laboratory and the IAGE startup, we use the digital PCR technique which is a higher-resolution version of quantitative PCR. This allows us to know how many copies of the viral genome are present in the samples. With weekly sampling, we can know the trend in virus concentrations in the wastewater.

What value is there in quantifying the virus in wastewater?

MLF: This method allows for early detection of viral infections: SARS-CoV-2 is present in feces the day after infection. It is therefore possible to detect infection well before the first potential symptoms appear in individuals. This makes it possible to determine quickly whether the virus is actively circulating or not and whether there is an increase, stagnation or decrease in infections. However, at the scale at which these studies are conducted, it is impossible to know who is infected, or how many people are infected, because the viral load is variable among individuals.

How can your study on the IMT Mines Alès campus contribute to this type of approach?

MLF: To date, studies of this type have been conducted at a city level. We have reduced the cohorts to the scale of the school campus, as well as to different buildings on campus. This has allowed us to trace the sampling information from the entire school to specific points within it. Since mid-August, we have been able to observe the effects of the different events that influence the circulation of the virus, in both directions.

What kind of events are we talking about?

MLF: For example, in October, we quickly saw the effect of a party in a campus building: only 72 hours later, we observed a spike in virus circulation in the wastewater of that building, thus indicating new infections. On the contrary: when restrictive measures were put in place, such as quarantine or a second lockdown, we could see a decrease in virus circulation in the following days. This is faster than waiting to see the impact of a lockdown on infection rates 2 to 3 weeks after its implementation. This not only shows the effectiveness of the measures, but also allows us to know where the infections come from and to link them to probable causes.

What could this type of approach contribute to the management of the crisis?

MLF: This approach is less time-consuming and much less expensive than testing every person to track the epidemic. On the scale of schools or similar organizations, this would allow rapid action to be taken, for example, to quarantine certain areas before infection rates become too great. In general, this would better limit the spread and anticipate future situations, such as peak hospitalizations, up to three weeks before they occur.

By Antonin Counillon

Antenne 5G

What is beamforming?

Beamforming is a telecommunications technology that enables the targeted delivery of larger and faster signals. The development of 5G relies in particular on beamforming. Florian Kaltenberger, researcher at EURECOM and 5G specialist, explains how this technology works.

What is beamforming?

Florian Kaltenberger: Beamforming consists of transmitting synchronized waves in the form of beams, from an antenna. This makes it possible to target a precise area, unlike conventional transmission systems that emit waves in all directions. This is not a new technology, it has been used for a long time in satellite communication and for radar. But it is entering mobile telecommunications for the first time with 5G.

Why is beamforming used in 5G?

FK: The principle of 5G is to direct the wave beams directly to the users. This allows a limited interference between the waves, having a more reliable signal, and saving energy. These three conditions are some of the demands that 5G must meet. Because the waves of 5G signals have high frequencies, they can carry more information, and do so faster. This system avoids congestion in hotspots, i.e. there will be no throughput problems in places where there are many connections simultaneously. Also, the network can be more locally diverse: there can be completely different services used on the same network at the same time.

How does network coverage work with this system?

FK: Numerous antennas are needed. There are several reasons for this. The size of the antennas is proportional to the length of the waves they generate. As the wavelength of 5G signals is smaller, so is the size of the antennas: they are only a few centimeters long. But the energy that the antennas are able to emit is also proportional to their size: a 5G antenna alone could only generate a signal with a range of about ten meters. In order to increase the range, multiple 5G antennas are assembled on base stations and positioned to target a user whenever they are in range. This allows a range of about 100 meters in all directions. So you still need many base stations to cover the network of a city. With beamforming it is possible to target multiple users in the same area at the same time, as each beam can be directed at a single user.

How are the beams targeted to users and how are they then tracked?

The user’s position signal is received by different parts of the 5G antennas. On each of these parts, there is a shift in the time of arrival of the signal, depending on the angle at which it hits the antenna. With mathematical models that incorporate these different time shifts, it is possible to locate the user and target the beam in their direction.

Then you have to track the users, and that’s more complicated. Base stations use sets of fixed beams that point at preset angles. There is a mechanism that allows the user’s device to measure the power of the received beam relative to adjacent beams. The device sends this information back to the base station, which is then able to choose the best beam.

What are the main difficulties when it comes to implementing beamforming?

FK: Today the 5G network still cannot work without the 4G network because of the short range of the beams, which makes its use only effective and useful in urban environments, and especially in hotspots. In more remote areas, 4G takes over. Beamforming cannot be used for a mobile user located several hundred meters from the antenna – let alone a few kilometers away in the countryside. Another difficulty encountered is the movement of users as they move from one base station to another. Algorithms are being developed to anticipate these movements, which is also what we are working on at EURECOM.

Should we expect the next generation of mobile communications, 6G, to go even further than beamforming?

FK: With every generation, there is a breakthrough. For example, 3G was initially designed as a voice communication network, then all the aspects related to internet data were implemented. For 4G it was the other way around: the network was designed to carry internet data, then voice communication was implemented. The operating principle of 6G has not yet been clearly defined. There’s roughly one new generation of cell phones every ten years, so it shouldn’t be long before the foundation for 6G is laid, and we’ll know more about the future of beamforming.

Interview by Antonin Counillon

Data collection protection, GDPR impact

GDPR: Impact on data collection at the international level

The European data protection regulation (GDPR), introduced in 2018, set limits on the use of trackers that collect personal data. This data is used to target advertising to users. Vincent Lefrère, associate professor in digital economy at Institut Mines-Télécom Business School, worked with Alessandro Acquisti from Carnegie Mellon University to study the impact of the GDPR on tracking users in Europe and internationally.

What was your strategy for analyzing the impact of GDPR on tracking users in different countries?

Vincent Lefrère: We conducted our research on online media such as Le Monde in France or the New York Times in the United States. We looked at whether the introduction of the GDPR has had an impact on the extent to which users are tracked and the amount of personal data collected.

How were you able to carry out these analyses at the international level?

VL: The work was carried out in partnership with researchers at Carnegie Mellon University in the United States, in particular Alessandro Acquisti, who is one of the world’s specialists in personal digital data. We worked together to devise the experimental design and create a wider partnership with researchers at other American universities, in particular the Minnesota Carlson School of Management and Cornell University in New York.

How does the GDPR limit the collection of personal data?

VL: One of the fundamental principles of the GDPR is consent. This makes it possible to require websites that collect data to obtain users’ consent  before tracking them. In our study, we never gave our consent or explicitly refused the collection of data. That way, we could observe how a website behaves in relation to a neutral user. Moreover, one of the important features of GDPR is that it applies to all parties who wish to process data pertaining to European citizens. As such, the New York Times must comply with the GDPR when a website visitor is European. 

How did you compare the impact of the GDPR on different media?

VL: We logged into different media sites with IP addresses from different countries, in particular with French and American IP addresses.

We observed that American websites limit tracking more than European websites, and therefore better comply with the GDPR, but only when we were using a European IP address.  It would therefore appear that the GDPR has been more dissuasive on American websites for these users. However, the American websites increased the tracking of American users, for whom the GDPR does not apply.  One hypothesis is that this increase is used to offset the loss of data from European users.

How have online media adapted to the GDPR?

VL: We were able to observe a number of effects. First of all, online media websites have not really played along. Since mechanisms of consent are somewhat vague,  the formats developed in recent years have often encouraged users to accept personal data collection rather than reject it. There are reasons for this: data collection has become crucial to the business model of these websites, but little has been done to offset the loss of data resulting from the introduction of the GDPR, so it is understandable that they have stretched the limits of the law in order to continue offering high quality content for free. With the recent update by the French National Commission on Information Technology and Liberties (CNIL) to fight against this, consent mechanisms will become clearer and more standardized.  

In addition, the GDPR has limited tracking of users by third parties, and replaced it with tracking by first parties. Before, when a user logged into a news site, other companies such as Google, Amazon or Facebook could collect their data directly on the website. Now, the website itself tracks data, which may then be shared with third parties.

Following the introduction of the GDPR, the market share of Google’s online advertising service increased in Europe, since Google is one of the few companies who could pay the quota for the regulation, meaning it could pay the price of ensuring compliance. This is an unintended, perverse  consequence: smaller competitors have disappeared and there has been a concentration of ownership of data by Google.  

Has the GDPR had an effect on the content produced by the media?

VL: We measured the quantity and quality of content produced by the media. Quantity simply reflects the number of posts. The quality is assessed by the user engagement rate, meaning the number of comments or likes, as well as the number of pages viewed each time a user visits the website.

In the theoretical framework for our research, online media websites use targeted advertising to generate revenue. Since the GDPR makes access to data more difficult, it could decrease websites’ financing capacity and therefore lead to a reduction in content quality or quantity. By verifying these aspects, we can gain insights into the role of personal data and targeted advertising in the business model for this system.   

Our preliminary results show that after the introduction of the GDPR, the quantity of content produced by European websites was not affected, and the amount of engagement remained stable. However, European users reduced the amount of time they spent on European websites in comparison to American websites. This could be due to the the fact that certain American websites may have prohibited access to European users, or that American websites covered European topics less since attracting European users had become less profitable. These are hypotheses that we are currently discussing.

We are assessing these possible explanations by analyzing data about the newspapers’ business models, in order to estimate how important personal data and targeted advertising are to these business models.  

By Antonin Counillon

intelligence artificielle, artificial intelligence

Is there intelligence in artificial intelligence?

Jean-Louis Dessalles, Télécom Paris – Institut Mines-Télécom (IMT)

Nearly a decade ago, in 2012, the scientific world was enthralled by the achievements of deep learning.  Three years later, this technique enabled the AlphaGo program to beat Go champions. And this frightened some people. Elon MuskStephen Hawking and Bill Gates were worried about an imminent end to the human race, replaced by out-of-control artificial intelligence.

Wasn’t this a bit of an exaggeration? AI thinks so. In an article it wrote in 2020 in The Guardian, GPT-3, a gigantic neural network with 175 billion parameters explains:

“I’m here to convince you not to worry. Artificial intelligence will not destroy humans. Believe me.”

At the same time, we know that the power of computers continues to increase. Training a network like GPT-3 was literally unconceivable just five years ago. It is impossible to know what its successors may be able to do five, ten or twenty years from now. If current neural networks can replace dermatologists, why would they not eventually replace all of us? Let’s turn the question around.

Are there any human mental abilities that remain strictly out of reach for artificial intelligence?

The first thing that comes to mind are skills involving our “intuition” or “creativity.” No such luck – AI is coming for us in these areas too. This is evidenced by the fact that works created by programs are sold at high prices, reaching nearly half a million dollars at times. When it comes to music, everyone will obviously form their own opinion, but we can already recognize acceptable bluegrass or works that approach Rachmaninoff in imitations by the MuseNet program created, like GPT-3, by OpenAI.

Should we soon submit with resignation to the inevitable supremacy of artificial intelligence? Before calling for a revolt, let’s take a look at what we’re up against. Artificial intelligence relies on many techniques,  but its recent success is due to one in particular: neural networks, especially deep learning ones. Yet a neural network is nothing more than a matching machine. The deep neural network that was much discussed in 2012 matched images –  a horse, a boat, mushrooms – with corresponding words. Hardly a reason to hail it as a genius.

Except that this matching mechanism has the rather miraculous property  of being “continuous.” If you present the network with a horse it has never seen, it recognizes it as a horse. If you add noise to an image, it does not disturb it. Why? Because the continuity of the process ensures that if the input to the network changes slightly, its output will change slightly as well. If you force the network, which always hesitates, to opt for its best response, it will probably not vary: a horse remains a horse, even if it is different from the examples learned, even if the image is noisy.

Matching is not enough

But why is such matching behavior referred to as “intelligent?” The answer seems clear: it makes it possible to diagnose melanoma, grant bank loans, keep a vehicle on the road, detect disorders in physiological signals and so forth. Through their matching ability, these networks acquire forms of expertise that require years of study for humans. And when one of these skills, for example, writing a press article, seems to resist for a while, the machine must simply be fed more examples, as was the case with GPT-3, so that it can start to produce convincing results.

Is this really what it means to be intelligent? No, this type of performance represents only a small aspect of intelligence, at best. What the neural networks do resembles learning by heart. It isn’t, of course, since networks continuously  fill in the gaps between the examples with which they have been presented. Let’s call it’s almost-by heart. Human experts, whether doctors, pilots or Go players, often act the same way when they decide instinctively, based on the large number of examples learned during their training. But humans have many other powers too.

Learning to calculate or reason over time  

Neural networks cannot learn to calculate. There are limits to matching operations like 32+73 and their result. They can only reproduce the strategy of the struggling student who tries to guess the result and sometimes happens upon the right answer. If calculating is too difficult, what about a basic IQ test like: continue the sequence 1223334444. Matching based on continuity is of no help to see that the structure, n repeated n times, continues with 5 fives. Still too difficult? Matching programs cannot even guess that an animal that is dead on Tuesday will not be alive on Wednesday. Why? What do they lack?  

Modeling in cognitive science has shown the existence of several mechanisms, other than matching based on continuity, which are all components of human intelligence. Since their expertise is entirely precalculated, neural networks cannot reason over time to determine that a dead animal remains dead or to understand the meaning of the sentence “he still isn’t dead” and the oddity of this other sentence: “he is not still dead.” And digesting large amounts of data in advance is not enough to allow them to recognize new structures that are very simple for us, such as groups of identical numbers in the sequence 1223334444. Their almost-by-heart strategy is also blind to unprecedented anomalies.

Detecting anomalies is an interesting example, since we often judge others’ intelligence based precisely on this. A neural network will not “see” that a face is missing a nose. Based on continuity, it will continue to recognize the person, or may confuse him or her with someone else. But it has no way of realizing that the absence of a nose in the middle of a face represents an anomaly.

There are many other cognitive mechanisms that are inaccessible to neural networks. Research is being conducted on the automation of these mechanisms. It implements operations carried out at the time of processing,  while neural networks simply make associations learned in advance.

With a decade of perspective on deep learning, the informed public is starting to see neural networks  more as “super-automation” and less as intelligent. For example, the media recently reported on the astonishing performances of the DALL-E program, which produces creative images based on a verbal description – for example, images that DALL-E imagined based on the terms “avocado-shaped chair” on the OpenAI site. We now hear much more tempered assessments than the alarmist reactions following the release of AlphaGo: “It is quite impressive, but we must not forget that it is an artificial neural network, trained to perform a task; there is no creativity or form of intelligence.” (Fabienne Chauvière, France Inter, 31 January 2021)

No form of intelligence? Let’s not be too demanding, but at the same time, let’s remain clear-sighted about the huge gap that separate neural networks from what would be a true artificial intelligence.

Jean‑Louis Dessalles wrote “Des intelligences très artificielles” (Very Artificial Intelligence)  published by Odile Jacob (2019).

Jean-Louis Dessalles, Associate professor at Télécom Paris – Institut Mines-Télécom (IMT)

This article has been republished from The Conversation under a Creative Commons license. Read the original article in French.