nucléaire

Three Mile Island, Chernobyl, Fukushima: the role of accidents in nuclear governance

Stéphanie TillementIMT Atlantique – Institut Mines-Télécom and Olivier BorrazSciences Po

Until the 1970s, nuclear power plants were considered to be inherently safe, by design. Accidents were perceived as being highly unlikely, if not impossible, by designers and operators, in spite of recurring incidents that were not publicized.

This changed abruptly in 1979 with the Three Mile Island (TMI) accident in the United States. It was given wide media coverage, despite the fact that there were no casualties, and demonstrated that what were referred to as “major” accidents were possible, with a meltdown in this case.

The decades that followed have been marked by the occurrence of two other major accidents rated as level 7 on the INES (International Nuclear Event) scale: Chernobyl in 1986 and Fukushima in 2011.

Turning point in the 1980s

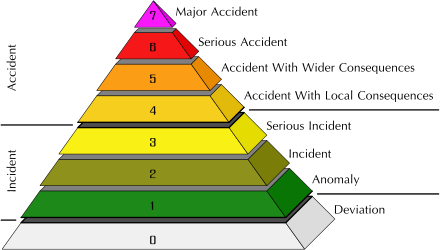
This article will not address this organization or the invention, in the wake of the Chernobyl accident, of the  INES scale used to rank events that jeopardize safety on a graduated scale, ranging from a deviation from a standard to a major accident.

Our starting point will be the shift that occurred in 1979, when accidents changed from being seen as unconceivable to a possible event, considered and described by nuclear experts as an opportunity for learning and improvement.  

Accidents therefore provide an opportunity to “learn lessons” in order to enhance nuclear safety and strive for continuous improvement.

But what lessons precisely? Has the most recent accident, Fukushima, led to profound changes in nuclear risk governance, as Chernobyl did?

The end of the human error rationale

Three Mile Island is often cited as the first nuclear accident: despite the technical and procedural barriers in place at the time, the accident occurred – such an accident was therefore possible.

Some, such as sociologist Charles Perrow, even described it as “normal,” meaning inevitable, due to the complexity of nuclear facilities and their highly coupled nature – meaning that the components that make up the system are closely interconnected – which are likely to lead to hard-to-control “snowball effects.”

For institutional, industrial and academic experts, the analysis of the accident changed views on man’s role in these systems and on human error: accidents went from being a moral problem, attributable to humans’ “bad behavior”, to a systematic problem, attributable to poor system design.

Breaking with the human error rationale, these lessons paved the way for the systematization of learning from experience, promoting a focus on transparency and learning.  

Chernobyl and risk governance

It was with Chernobyl that accidents became “organizational,” leading nuclear organizations and public authorities to introduce structural reforms of safety doctrines, based on recognition of the essential nature of “organizational and cultural problems […] for the safety of operations.” (AIEA, 1999).

Chernobyl also marked the beginning of major changes in risk governance arrangements at the international, European and French levels. An array of organizations and legal and regulatory provisions were introduced, with the twofold aim of learning from the accident that occurred at the Ukrainian power plant and preventing such an accident from happening elsewhere.

The law of 13 June 2006 on “Nuclear Transparency and Safety” (referred to as TSN) proclaiming, among other things, the ASN’s status as an administrative authority independent from the government, is one emblematic example.

A possibility for every country

25 years after Chernobyl, Japan experienced an accident at its Fukushima-Daiichi power plant.

Whereas the accident that occurred in 1986 could be attributed in part to the Soviet regime and its RBMK technology, the 2011 catastrophe involved American-designed technology and a country that many considered to be at the forefront of modernity.

With Fukushima, a serious accident once again became a possibility that no country could rule out. And yet, it did not give rise to the same level of mobilization as that of 1986.  

Fukushima – a breaking point?

Ten years after the Japanese catastrophe, it can be said that it did not bring about any profound shifts – whether in the way facility safety is designed, managed and monitored, or in the plans and arrangements designed to manage a similar crisis in France (or in Europe).

This has been shown in the research carried out through the Agoras research project.

As far as preparedness for crisis management is concerned, Fukushima led to a re-examination of the temporal boundaries between the emergency phase and the post-accident phase, and for greater investment in the latter.

This catastrophe also led the French authorities to publish a preparedness plan in 2014 for managing a nuclear accident, making it a part of the common crisis management system.

These two aspects are reflected in the strengthening of the public safety portion of the national crisis management exercises carried out annually in France.   

But, as underscored by recent research, the observation of these national exercises did not reveal significant changes, whether in the way they are organized and carried out, the content of plans and arrangements, or, more generally, in the approach to a crisis caused by a major accident – with the exception of the creation of national groups that can intervene quickly on site (FARN).

Limited changes

It may, of course, be argued that, like the effects of the Three Mile Island and Chernobyl accidents, structural transformations take time and it may still be too early to observe a lack of significant change.

But the research carried out through the Agoras project leads us to put forward the hypothesis that changes remain limited, based on two reasons.

The first reason comes from the fact that structural changes were initiated in the 20 years following the Chernobyl  accident. This period saw the rise of organizations dedicated to accident prevention and crisis management preparedness, such as the ASN in France, and European (WENRA, ENSREG) and international cooperation organizations.

These organizations initiated continuous research on nuclear accidents, gradually developing tools for  understanding and responding to accidents, as well as mechanisms for coordination between public officials and industry leaders at the national and international levels.

These tools were “activated” following the Fukushima accident and made it possible to quickly provide an explanation for the accident, launch shared procedures such as supplementary safety assessments (the  much-discussed “stress tests”), and collectively propose limited revisions to nuclear safety standards.

This work contributed to normalizing the accident, by bringing it into existing organizations and frameworks for thinking about nuclear safety.

This helped establish the conviction, among industry professionals and French public authorities, that the  governance regime in place was capable of preventing and responding to a large-scale event, without the need to profoundly reform it.

The inertia of the French system

A second reason comes from the close relationships in France between the major players in the civil nuclear sector (operators – EDF primarily – and regulators – the ASN and its technical support organization IRSN), in particular with regard to establishing and assessing safety measures at power plants.

These relationships form an exceptionally stable organized action system. The Fukushima accident provided a short window of opportunity to impose additional measures on operators.

Read more: L’heure des comptes a sonné pour le nucléaire français (Time for a Reckoning in the French Nuclear Industry)

But this window closed quickly, and the action system returned to a stable state. The inertia of this system can be seen in the production of new regulatory instruments, the development and upgrading of which take several years.   

It can also be seen in the organization of crisis management exercises, which continue to perpetuate distinctions between safety and security, accident and crisis, the facility interiors and the environment, and more generally, between technical and political considerations – distinctions that preserve the structure and content of relationships between regulators and operators.

Learning from accidents

Like Chernobyl, Fukushima was first viewed as an exceptional event: by insisting on the perfect storm of a tsunami of unprecedented magnitude and a nuclear power plant, highlighting the lack of an independent regulatory agency in Japan, insisting on the excessive respect for hierarchy among the Japanese, the aim was to construct a unique event so as to suggest that it could not happen in the same way in other parts of the world.

But, at the same time, a normalization process took place, in France in particular, focusing not as much on the event itself, as on the risks it posed for the organization of the nuclear industry, meaning stakeholders and forms of knowledge with legitimacy and authority.

The normalization process led to the accident being included in the existing categories, institutions and systems, in order to demonstrate their ability to prevent such an accident from happening and to limit the impact, should such an accident occur.

This was the result of efforts to delineate the boundaries, with some parties seeking to maintain them and others disputing them and trying to change them.

Ultimately, the boundaries upheld so strongly by industry stakeholders (operators and regulators) – between technical and political considerations, between experts and laymen – were maintained.

Relentlessly questioning nuclear governance

While the Fukushima accident was taken up by political and civil society leaders to challenge the governance of the nuclear industry and its “closed-off” nature, operators and regulators in France and throughout Europe quickly took steps to demonstrate their ability both to prevent such an accident, and to manage the consequences, in order to suggest that they could continue to be entrusted with regulating this sector.

As far as making the sector more open to civil society players is concerned, this movement was initiated well before the Fukushima accident (with the TSN Law in 2006, notably), and was, at best, the continuation of a pre-existing trend.

But other boundaries seem to have emerged or been strengthened in recent years, especially between technical factors and human and organizational factors, or safety requirements and other requirements for nuclear organizations (economic and industrial performance in particular), although it is not exactly clear whether this is related to the accidents.

These movements go hand in hand with a bureaucratization of relationships between the regulator and its technical expert, and between these two parties and operators, and require further research in order to investigate their effects on the foundations of nuclear risk governance.

Talking and listening to one another

As like causes produce like effects, it is indeed the fact that the nuclear industry is unreceptive to any “uncomfortable knowledge” – based on the idea introduced by Steve Rayner – that is the problem.

Social science research has long demonstrated that in order to solve complex problems, a wide range of individuals from various backgrounds and training must be brought together, for research that transcends disciplinary and institutional boundaries.

Social science researchers, engineers and public authorities must talk to – and more importantly – listen to one another. For engineers and policy-makers, that means being ready to take into account facts or knowledge that may challenge established doctrines and arrangements and their legitimacy.  

And social science researchers must be ready to go and see nuclear organizations, to get a first-hand look at their day-to-day operations, listen to industry stakeholders and observe working situations.

But our experience, in particular through Agoras, has shown us that not only is such work time-consuming and costly, it is also fraught with pitfalls. For even when one stakeholder does come to see the soundness of certain knowledge, the highly interconnected nature of relationships with other industry stakeholders, who make up the governance system, complicates the practical implementation of this knowledge, and therefore prevents major changes from being made to governance arrangements.

Ultimately, the highly interconnected nature of the nuclear industry’s governance system is arguably one of the vulnerabilities.  

Stéphanie Tillement, Sociologist, IMT Atlantique – Institut Mines-Télécom and Olivier Borraz, CNRS Research Director – Centre for the Sociology of Organisations, Sciences Po

This article has been republished from The Conversation under a Creative Commons license. Read the  original article (in French).

flux des conteneurs

DMS Logistics is optimizing inland container transportation

The inland container logistics chain suffers from low digitization, which limits organization and communication between the various parts of the chain. To overcome this problem, the start-up DMS Logistics, incubated at Mines Saint-Étienne, is developing a platform to optimize management of these flows of goods. It uses machine learning methods to automate the creation of schedules, reduce congestion at terminals and boost the competitiveness of ports and their logistics networks.

Ports’ ability to streamline the transfer of goods impacts their competitiveness in a sector where the competition is fierce. Yet, one of the major problems for this type of infrastructure is their permanent congestion. This is explained in part by the physical capacity to receive trucks at terminals, but is also due to the lack of anticipation in the exchange of containers with carriers. This results in costly slowdowns and detention charges for every delay. At the heart of the problem is a lack of communication between the various participants in the same supply chain: terminals, road carriers, container parks, ship-owners, freight forwarders etc.

To help overcome this problem, the start-up DMS Logistics seeks to bring together all of these participants through a platform to optimize and anticipate the inland flow of containers. “This is a major market with 800 million containers exchanged every year worldwide,” explains one of the three founders, Xavier Des Minières, a specialist in inland logistics. Using operational data from each participant in the chain, the start-up has successfully optimized the overall supply chain rather than an individual part of the chain. This software solution therefore achieves the goals of the French government’s strategic plan “France Logistics 2025” initiated in 2016 to make national logistics more efficient and attractive.

Digitizing companies that work with containers

The logistics sector is still little digitized. It is made up of many SMEs with very small profit margins who cannot afford to buy digital tools to manage their operations,” explains Xavier Des Minières. DMS Logistics is solving this problem by equipping these users digitally and adapting to their resources. However, the solution becomes more useful when it groups together all the parts of the supply chain. To do so, the company is targeting the terminals around which all the other inland transportation participants revolve.

DMS Logistics’ solution is a distributed cloud-based SaaS (Software as a Service) platform. It enables users to enter their operational data online: container movement, missions to accomplish or already carried out etc. For participants that have already gone digital, the service connects to their data through an API (Application Programming Interface) protocol. Since it was founded in 2020, the start-up has collected 700,000 container movements. This massive amount of data will feed its machine learning algorithms. “We’re automating three key time-consuming actions: managing operations schedules, making appointments at terminals and communication between partners,” says Xavier Des Minières.

Predicting flows based on data history

Why does this sector need to be automated? In the field, many participants in the chain respond to management difficulties in real time, using walkie-talkies or over the phone. They are constantly dealing with seemingly unforeseen difficulties. “However, we have shown that there is a lot of redundancy in the operational behavior of the various participants. The difficulties are therefore predictable and our algorithms make it possible to anticipate them,” explainsCyriac Azefack, a data scientist at DMS Logistics who holds a PhD in artificial intelligence.

The prediction is even more accurate when it cross-references data from the various participants. For example, carriers can optimize drivers’ schedules based on times for appointments offered by terminals to pick up goods. Furthermore, carriers’ behavior (history of their operations, inventory movement etc.) can be used to identify appropriate time slots for these appointments. Carriers can then access the terminal when it is convenient for them to do so and when it is not crowded. This seemingly simple organization was not possible before now.

An even higher level of optimization can be reached. “Still using carriers’ behavioral data, we identify the drivers and trucks that are most suited for a mission (local, long distance, etc.),” adds Taki-Eddine Korabi, a data scientist at DMS Logistics who holds a PhD in mathematics, computer science and automation. Ultimately, the overall optimization of an ecosystem results in better local management.

Towards the optimization of local logistics ecosystems

DMS Logistics’ solution is distributed in the Ivory Coast and in Marseille, where a team of 12 people are  based. “After 4 months of operations at our pilot facility, we can predict the arrival of trucks at a terminal with a reliability rate of 98% over a week,” explains Xavier Des Minières. For the terminal, this means 15% savings in resources. Moreover, when a port is efficient, it boosts the attractiveness of the entire region. The economic benefits are therefore wide-ranging.

Another key finding: optimizing flow at the terminals also helps the ports in their efforts toward ecological transition. More efficient organization means less unnecessary transportation, a reduction in traffic at ports, and therefore less local pollution. And air quality is improved. 

On the scientific side, research has only focused on optimizing container carriers’ operations since 2015 and on-the-ground information is still lacking. “We’re going to be starting a Cifre PhD with Mines Saint-Étienne which will rely on the use of data collected by our platform. That will allow us to explore this topic in an optimal way and offer bright prospects for research and the logistics business,” concludes Taki-Eddine Korabi.

By Anaïs Culot

Read on I’MTech: AlertSmartCity, Cook-e, Dastra, DMS, GoodFloow, JobRepublik, PlaceMeet and Spectronite supported by the “honor loan” scheme

MANIFESTS

Decision support tools for maritime accident management

The European MANIFESTS project, launched in January, is a two-year project bringing together a consortium of nine research institutions and public administrations with complementary expertise in managing maritime accidents. Funded by the European Commission, this project aims to improve responses to emergencies related to these accidents. An interview with Laurent Aprin, a researcher at IMT Mines Alès, a project partner.

Could you describe the broader context of the MANIFESTS project?

Laurent Aprin –The MANIFESTS project (Managing Risks and Impacts From Evaporating and Gaseous Substances to Population Safety) is a follow-up to the European HNS-MS project funded from 2015 to 2017 by the European Commission’s Directorate General for European Civil Protection and Humanitarian Aid (DG-ECHO). The purpose of this project was to study and model the consequences of chemical spills in the ocean and determine the vulnerability of the environment, people and goods depending on the chemicals spilled. We wanted to continue our research by expanding the consortium and addressing questions submitted by the various stakeholders at the end-of-project meeting, in particular the consequences of evaporating substances that are likely to form toxic clouds, which are flammable, or even explosive.

What is the aim of the MANIFESTS project?

LA ­– Responding to maritime accidents can be especially challenging when they involve Hazardous and Noxious Substances (HNS) which act like gases or evaporators. Due to their potential to form toxic or combustible clouds, fact-based decisions are needed to protect the crew, responders, coastal communities and the environment. But when an accident is declared, key information for assessing risks for responders or emergency teams is not always available. Allowing a ship that presents a risk to dock in a place of refuge due to a lack of knowledge and data could have major implications for coastal communities. The aim of MANIFESTS is to respond to these uncertainties and improve response capacity with decision support tools and novel and innovative operational guidelines. How so? By facilitating access to knowledge and databases, all of which are hosted on a dedicated open source web platform accessible to planners and responders.

How will you achieve this goal?

LA – The MANIFESTS project is divided into four activities (workpackages, WP) supported by two cross-project activities, project management (WP1) and project communication (WP6). The technical work includes producing new data and knowledge on gases and evaporating substances that may be released during marine accidents. This information will be obtained by acquiring knowledge from the literature and research data (WP2). WP3 involves developing methods to assess and manage risks and testing response tools through computer-based and field trials. WP4 will focus on developing and improving tools for modeling HNS behavior and developing a MANIFESTS decision support system. This WP includes developing  new tools based on the previously described WPs and upgrading the models developed in the existing HNS-MS and MARINER projects (WP5).

L’attribut alt de cette image est vide, son nom de fichier est image.png.

What scientific expertise are IMT Mines Alès researchers bringing to this project?

LA – IMT Mines Alès[1] researchers are primarily involved in two WPs:

  • WP2: improving knowledge and data on gases and evaporating substances for which IMT Mines Alès is the coordinator. This task aims to characterize and theoretically and experimentally assess the behavior and impacts of HNS when they are released into the ocean, with a particular focus on the release of volatile substances that may lead to the formation of a potentially toxic, flammable and/or explosive gas cloud.
  • WP6: strategy for dissemination, exploitation and visibility, in particular to develop proof of concept (PoC) for a serious games to train emergency responders and planners involved in managing marine pollution events. Using an immersive scenario, this crisis simulation makes it possible to test the implementation of response plans, the response cell’s capacity to fulfill its missions (including adapting during a dynamically evolving scenario) and to make defensible decisions under demanding, realistic conditions.

Who are your partners for this project and how are you working together?

LA – The project consortium is coordinated by Cedre (France)[2], and includes 9 research institutions and public administrations from 6 countries (France, Belgium, UK, Norway, Spain, Portugal) with strong complementary expertise: ARMINES/IMT Mines Alès (France), Royal Belgium Institute of Natural Science (RBINS, Belgium), Instituto Tecnológico para el Control del Medio Marino de Galicia (INTECMAR, Spain), Centro tecnologico del mar/Fundacion CETMAR (Spain), Instituto superior tecnico (Portugal), Department of Health (UK), Meteorologisk Institutt (Norway) and the Federal Public Service for Public Health, Food Chain Safety and Environment (Belgium). They are involved in all the aspects of marine pollution addressed by the project: chemical analysis, pollution modeling, developing decision support tools, risk assessment and management, training and exercises, knowledge transfer. MANIFESTS will also benefit from collaboration with an advisory committee comprising 6 national maritime authorities who will be the primary end-users of the project results, including the French Navy, CEPPOL (Centre of Practical Expertise for Pollution Response) and customs for France.

What are the next big steps for the project?

LA – The MANIFESTS project was launched on 1 January 20201 and is set to run for two years. The first phase will involve an accident study and a literature review of the modeling of the behavior of evaporating substances in the ocean. The next steps will focus on creating experimental designs to characterize the  evaporation rate of substances and the consequences of explosions, programming consequence models (dispersion, fire and explosion) and conducting a large-scale trial in the Atlantic Ocean.


[1] The IMT Mines Alès team includes Laurent Aprin, Aurélia Bony-Dandrieux, Philippe Bouillet, Frédéric Heymes, Christian Lopez and Jérôme Tixier.

[2] Laura Cotte, engineer, and Stéphane Le Floch, Head of the Research Department at the Centre for Documentation, Research and Experimentation on Accidental Water Pollution (Cedre), are the initiators and coordinators of the project.

Interview by Véronique Charlet

Sobriété numérique, digital sobriety

What is digital sufficiency?

Digital consumption doubles every 5 years. This is due in particular to the growing number of digital devices and their increased use. This consumption also has an increasing impact on the environment. Digital sufficiency refers to finding the right balance for the use of digital technology in relation to the planet and its inhabitants. Fabrice Flipo, a researcher at Institut Mines-Télécom Business School and the author of the book “L’impératif de la sobriété numérique” (The Imperative of Digital Sufficiency) explains the issues relating to this sufficiency.

What observation is the concept of digital sufficiency based on?

Fabrice Flipo: On the observation of our increasing consumption of digital technology and its impacts on the environment, especially in terms of greenhouse gases. This impact is due to the growing use of digital tools and their manufacturing. Materials for digital tools depend on their extraction, which relies primarily on fossil fuels, and therefore carbon. The use of these tools is also increasingly energy-intensive.

The goal is to include digital technology in discussions currently underway in other sectors, such as energy or transportation. Until recently, digital technology has been left out of these debates. This is the end of the digital exception.

How can we calculate the environmental impacts of digital technology?

FF: The government’s roadmap for digital technology primarily addresses the manufacturing of digital tools, which it indicates accounts for 75% of its impacts. According to this roadmap, the solution is to extend the lifespan of digital tools and combat planned obsolescence. But that’s not enough, especially since digital devices have proliferated in all infrastructure and their use is increasingly costly in energy. The amount of data consumed doubles every 5 years or so and the carbon footprint of the industry has doubled in 15 years.  

It’s hard to compare figures about digital technology because they don’t all measure the same thing. For example, what should we count in order to measure internet consumption? The number of devices, the number of individual uses, the type of uses? So standardization work is needed.

A device such as a smartphone is used for many purposes. Consumption estimations are averages based on typical use scenarios. Another standardization issue is making indicators understandable for everyone. For example, what measurements should be taken into account to evaluate environmental impact?

What are the main energy-intensive uses of digital technology?

FF: Today, video is one of the uses that consumes the most energy. What matters is the size of the files and their being transmitted in computers and networks. Every time they are transmitted, energy is consumed. Video, especially high-resolution video, commands pixels to be switched on up to 60 times per second. The size of the files makes their transmission and processing very energy-intensive. This is the case for artificial intelligent programs that process images and video as well. Autonomous vehicles are also likely to use a lot of energy in the future, since they involve huge amounts of information. 

What are the mechanisms underlying the growth of digital technology?

FF: Big companies are investing heavily in this area. They use traditional marketing strategies: target an audience that is particularly receptive to arguments and able to pay, then gradually expand this audience and find new market opportunities. The widespread use of a device and a practice leads to a gradual phasing out of alternative physical methods. When digital technology starts to take hold in a certain area, it often ends up becoming a necessary part of our everyday lives, and is then hard to avoid. This is referred to as the “lock-in” effect. A device is first considered to be of little use, but then becomes indispensable. For example, the adoption of smartphones was largely facilitated by offers funded by charging other users, through the sale of SMS messages. This helped lower the market entry cost for the earliest adopters of smartphones and create economies of scale. Smartphones then became widespread. Now, it is hard to do without one.

How can we apply digital sufficiency to our lifestyles?

FF: Sufficiency is not simply a matter of “small acts”, but it cannot be enforced by a decree either. The idea is to bring social mindedness to our lifestyles, to regain power over the way we live. The balance of power is highly asymmetrical: on one side are the current or potential users who are scattered, and on the other are salespeople who tout only the advantages of their products and have extensive resources for research and for attracting customers. This skewed balance of power must be shifted. An important aspect is informing consumers’ choices. When we use digital devices today, we have no idea about how much energy we’re consuming or our environmental impact: we simply click. The aim is to make this information perceptible at every level, and to make it a public issue, something everyone’s concerned about. Collective intelligence must be called upon to change our lifestyles and reduce our use of digital technology, with help from laws if necessary.

For example, we could require manufacturers to obtain marketing authorization, as is required for medications. Before marketing a product or service (a new smartphone or 5G), the manufacturer or operator would have to provide figures for the social-ecological trajectory they seek to produce, through their investment strategy. This information would be widely disseminated and would allow consumers to understand what they are signing up for, collectively, when they choose 5G or a smartphone. That is what it means to be socially-minded: to realize that the isolated act of purchasing actually forms a system.

Today, this kind of analysis is carried out by certain associations or non-governmental organizations. For example, this is what The Shift Project does for free. The goal is therefore to transfer this responsibility and its cost to economic players who have far greater resources to put these kinds of analyses in place. Files including these analyses would then be submitted to impartial public organizations, who would decide whether or not a product or service may be marketed. The organizations that currently make such decisions are not impartial since they base their decisions on economic criteria and are stakeholders in the market that is seeking to expand.  

How can sufficiency be extended to a globalized digital market?  

FF: It works through a leverage effect: when a new regulation is established in one country, it helps give more weight to collectives that are dealing with the same topic in other countries. For example, when the electronic waste regulation was introduced, many institutions protested. But gradually, an increasing number of  countries have adopted this regulation.

Some argue that individual efforts suffice to improve the situation, while others think that the entire system must be changed through regulations. We must get away from such either-or reasoning and go beyond  opposing viewpoints in order to combine them. The two approaches are not exclusive and must be pursued simultaneously.

By Antonin Counillon

données de santé, health data

Speaking the language of health data to improve its use

The world of healthcare has extensive databases that are just waiting to be used. This is one of the issues Benjamin Dalmas, a data science researcher at Mines Saint-Étienne, is exploring in his work. His main objective is to understand the origin of this data to use it more effectively. As such, he is working with players from the public and private sectors for analysis and predictive purposes in order to improve management of health care institutions and our understanding of care pathways.

Research has made great strides in processing methods using machine learning. But what do we really know about the information that such methods use? Benjamin Dalmas is a health data science researcher at Mines Saint-Étienne. The central focus of his work is understanding health data, from its creation to its storage. What does this data include? Information such as the time of a patient’s arrival and discharge, exams carried out, practitioners consulted etc. This data is typically used for administrative and financial purposes.

Benjamin Dalmas’s research involves identifying and finding a straightforward way to present relevant information to respond to the concrete needs of public and private healthcare stakeholders. How can the number of beds in a hospital ward be optimized? Is it possible to predict the flow of arrivals in an emergency room? The responses to these problems rely on the same information: the medical administrative data produced every day by hospitals to monitor their patient pathways.

However, depending on the way in which it is considered, the same data can provide different information. It is the key witness to several investigations. So it must be approached in the right way to get answers.

Understanding data in order to prevent bias

Since it is primarily generated by humans, health data may be incorrect or biased. By focusing on its creation, researchers seek to identify the earliest potential bias. Benjamin Dalmas is working with Saint-Étienne University Hospital Center to study the codes assigned by the hospital upon a patient’s discharge. These codes summarize the reason for which the individual came to the hospital and received care. Doctors who specialize in this coding generate up to 16,000 different codes, a tedious task, for which the hospital wishes to seek assistance from a decision support tool to limit errors. “That means we must understand how humans code. By analyzing large quantities of data, we identify recurring errors and where they come from, and we can solve them,” explains Benjamin Dalmas. Greater accuracy means direct economic benefits for the institution.

However, this mass-produced data is increasingly used for other purposes than reimbursing hospitals. For the researcher, it is important to keep in mind that the data was not created for these new analyses. For example, he has noticed that such a straightforward notion as time may hide a number of different realities. When a consultation time is specified, it may mean one of three things: the actual time of consultation, the time at which the information was integrated in the file, or a time assigned by default. Since the primary objective of this information is administrative, the consultation time does not have a lot of importance. “If we don’t take the time to study this information, we run the risk of making biased recommendations that are not valid. Good tools cannot be created without understanding the data that fuels them,” says the researcher. Without this information, for example, a study focusing on whether or not social inequalities exist and taking into account how long a patient must wait before receiving care, could draw incorrect conclusions.

From reactive to proactive

So researchers must understand the data, but for what purpose? To predict, in order to anticipate, rather than just react. The development of predictive tools is the focus of a collaboration between Mines Saint-Étienne researchers and the company Move in Med. The goal is to anticipate the coordination of care pathways for breast cancer patients. In the case of chronic diseases such as cancer, the patient pathway is not limited to the hospital but also depends on a patient’s family, associations etc. To this end, the researchers are cross-referencing medical data with other social information (age, marital status, socio-economic background, place of residence etc.). Their aim is to identify unexpected factors, in the same way in which the weather, air quality and the even the occurrence of cultural events impact periods of peak arrival in emergency rooms. Predicting the complexity of a care pathway allows the company to allocate the appropriate resources and therefore ensure better care.

At the same time, the Auvergne Rhône-Alpes Regional Health Agency has been working with the researchers since May 2020 to predict hospital capacity strain levels for Covid arrivals. By reporting visual data based on systems of colors and arrows, the researchers provide information about changing dynamics and levels of hospital capacity strain in the region (Covid patient arrivals, positive PCR tests in the region, number of available beds etc.) In this work, researchers are tackling monitoring trends. How are these parameters evolving over time? At what threshold values do they alert the authorities that the situation is getting worse? To answer these questions, the research team provides maps and projections that the health agency can use to anticipate saturation and therefore prevent institutions from becoming overwhelmed, arrange for patients to be transferred etc.

Finding the right balance between volume and representativeness

The study of data raises questions about volume and representativeness, which depend on the user’s request. Proving without equipping oneself requires more data in order to fuel machine learning algorithms. “However, recovering public health data is quite an ordeal. We have to follow protocols that are highly regulated by the CNIL (the French Data Protection Authority) and ethics committees to justify the volume of data requested,” explains Benjamin Dalmas. On the other hand, a request for operational tools must be able to adapt to the on-the-ground realities faced by practitioners. That means working with limited amounts of information. It is a matter of finding the right balance.  

The Mines Saint-Étienne researchers are working with the Saint-Étienne-based company MJ INNOV on these aspects. The company offers an interactive facilitation tool to improve quality of life for individuals with cognitive impairments. Based on videos and sounds recorded during the stages of play, this research seeks to identify the impact of the practice on various subjects (nursing home residents, persons with Alzheimer’s disease etc.). In addition to using the information contained in residents’ files, this involves collecting a limited quantity of new information. “In an ideal world, we would have 360° images and perfect sound coverage. But in practice, to avoid disturbing the game, we have to plan on placing microphones under the table the patients are playing on, or fitting the camera directly within the inside of the table. Working with these constraints makes our analysis even more interesting,” says Benjamin Dalmas.

Measuring the impact of healthcare decision support tools

In the best-case scenario, researchers successfully create a decision support tool that is accessible online. But is the tool always adopted by the interested parties? “There are very few studies on the ergonomics of tools delivered to users and therefore on their impact and actual use,” says Benjamin Dalmas. Yet, this is a crucial question in his opinion, if we seek to improve data science research in such a concrete area of application as healthcare.  

To this end, an appropriate solution often means simplicity. First of all, by being easy-to-read: color schemes, shapes, arrows etc. Visualization and interpretation of data must be intuitive. Second, by promoting explainability of results. One of the drawbacks of machine learning is that the information provided seems to come from a black box. “Research efforts must now focus on the presentation of results, by enhancing communication between researchers and users,” concludes Benjamin Dalmas.

By Anaïs Culot

Read more on I’MTech: When AI helps predict a patient’s care pathway

réseaux optiques, optical networks

The virtualization of optical networks to support… 5G

Mobile networks are not entirely wireless. They also rely on a network of optical fibers, which connect antennas to the core network, among other things. With the arrival of 5G, optical networks must be able to keep up with the ramping up of the rest of the mobile network to ensure the promised quality of service. Two IMT Atlantique researchers are working on this issue, by making optical networks smarter and more flexible.  

In discussions of issues surrounding 5G, it is common to hear about the installation of a large number of antennas or the need for compatible devices. But we often overlook a crucial aspect of mobile networks: the fiber optic infrastructure on which they rely. Like previous generations, 5G relies on a wired connection in most cases. This technology is also used in the “last mile”. It therefore makes it possible to connect antennas to core network equipment, which is linked to most of the connected machines around the world. It can also connect various devices within the same antenna site.

In reality, 5G is even more dependent on this infrastructure than previous generations since the next-generation technology comes with new requirements related to new uses, such as the Internet of Things (IoT). For example, an application such as an autonomous car requires high availability, perfect reliability, very-low latency etc. All of these constraints weigh on the overall architecture, which includes fiber optics. If they cannot adapt to new demands within the last mile, the promises of 5G will be jeopardized. And new services (industry 4.0, connected cities, telesurgery etc.) will simply not be able to be provided in a reliable, secure way.

Facilitating network management through better interoperability

Today, optical networks are usually over-provizioned in relation to current average throughput needs. They are designed to be able to absorb 4G peak loads and are neither optimized, nor able to adapt intelligently to fluctuating demand. The new reality created by 5G, therefore represents both a threat for infrastructure in terms of its ability to respond to new challenges, and an opportunity to rethink its management.

Isabel Amigo and Luiz Anet Neto, telecommunications researchers at IMT Atlantique, are working with a team of researchers and PhD students to conduct research in this area. Their goal is to make optical networks smarter, more flexible and more independent from the proprietary systems imposed by vendors. A growing number of operators are moving in this direction. “At Orange, it used to be common to meet specialists in configuration syntaxes and equipment management for just one or two vendors,” explains Luiz Anet Neto, who worked for the French group for five years. “Now, teams are starting to set up a “translation layer” that turns the various configurations, which are specific to each vendor, into a common language that is more straightforward and abstract.”

This “translation layer”, on which he is working with other researchers, is called SDN, which stands for Software-Defined Networking. This model is already used in the wireless part of the network and involves offloading certain functions of network equipment. Traditionally, this equipment fulfills many missions: data processing (receiving and sending packets back to their destination), as well as a number of control tasks (routing protocols, transmission interfaces etc.) With SDN, equipment is relieved from these control tasks, which are centralized within an “orchestrator” entity that can control several devices at once.  

Read more on I’MTech: What is SDN?

There are many benefits to this approach. It provides an overview of the network, making it easier to manage, while making it possible to control all of the equipment, regardless of its vendor without having to know any proprietary language. “To understand the benefit of SDN, we can use an analogy between a personal computer and the SDN paradigm,” says Isabel Amigo. “Today, it would be unthinkable to have a computer that would only run applications that use a specific language. So, machines have an additional layer – the operating system – that is in charge of “translating” the various languages, as well as managing resources, memory, disks etc. SDN therefore aims to act like an operating system, but for the network.” Similarly, the goal is to be able to install applications that are able to work on any equipment, regardless of the hardware vendor. These applications could, for example, distribute the load based on demand.

Breaking our dependence on hardware vendors

SDN often goes hand in hand with another concept, inspired by virtualization in data centers: NFV (Network Functions Virtualization). Its principle: being able to execute any network functionality (not just control functions) on generic servers via software applications.”Usually, dedicated equipment is required for these functions,” says the IMT researcher. “For example, if you want to have a firewall, you need to buy a specific device from a vendor. With NFV, this is no longer necessary: you can implement the function on any server via an application.”

Read more on I’MTech: What is NFV?

As with SDN, the arrival of virtualization in optical networks promotes better interoperability. This makes it harder for vendors to require the use of their proprietary systems linked to their equipment. The market is also changing, by making more room for software developers. “But there is still a long way to go,” says Luiz Anet Neto. “Software providers can also try to make their customers dependent on their products, through closed systems. So operators have to remain vigilant and offer an increasing level of interoperability.”

Operators are working with the academic world precisely for this purpose. They would fully benefit from standardization, which would simplify the management of their optical networks. Laboratory tests carried out by IMT Atlantique in partnership with Orange provide them with technical information and areas to explore ahead of discussions with vendors and standardization bodies.

Sights are already set on 6G

For the research teams, there are many areas for development. First of all, the scientists are seeking to further demonstrate the value of their research, through testing focusing on a specific 5G service (up to now, the experiments have not applied to a specific application). Their aim is to establish recommendations for optical link dimensioning to connect mobile network equipment.

The goal is then to move towards smart optimization of optical networks. To provide an example of how findings by IMT Atlantique researchers may be applied, it is currently possible to add a “probe” that can determine if a path is overloaded and shift certain services to another link if necessary. The idea would then be to develop more in-depth mathematical modeling of the phenomena encountered, in order to automate incident resolution using artificial intelligence algorithms.

And it is already time for researchers to look toward the future of technology. “Mobile networks are upgraded at a dizzying pace; new generations come out every ten years,” says Luiz Anet Neto. “So we already have to be thinking about how to meet future requirements for 6G!

Bastien Contreras

Projet MAESTRIA AVC

A European consortium for early detection of stroke and atrial fibrillation

The European project MAESTRIA, launched in March 2021 and set to run 5 years, will take on the major challenges of data integration and personalized medicine with the aim of preventing heart rhythm problems and stroke. How? By using artificial intelligence approaches to create multi-parametric digital tools. Led by Sorbonne University and funded by the European Union to the tune of €14 million, the project brings together European, English, Canadian and American partners. An interview with Anne-Sophie Taillandier, Director of Teralab, IMT’s Big Data and AI platform, which is a member of the consortium.   

In what health context was the MAESTRIA developed?

Anne-Sophie Taillandier – Atrial fibrillation (AF), heart rhythm disorder and stroke are major health problems in Europe. Most often, they are the clinical expression of atrial cardiomyopathy, which is under-recognized due to a lack of specific diagnostic tools.

What is the aim of MAESTRIA?

AST  MAESTRIA (for Machine Learning Artificial Intelligence for Early Detection of Stroke and Atrial Fibrillation) aims to prevent the risks associated with atrial fibrillation in order to ensure healthy ageing in the European population. Multidisciplinary research and stratified approaches (involving adapting  a patient’s treatment depending on his/her biological characteristics) are needed to diagnose and treat AF and stroke.

What technologies will be deployed?

AST  “Digital twin” technologies, a powerful data integrator combining biophysics and AI, will be used to generate virtual twins of human heart atria using patient-specific data.

MAESTRIA will create digital multi-parametric digital tools based on a new generation of biomarkers that integrate artificial intelligence (AI) and big data from cutting-edge imaging, electrocardiography and omics technologies (including physiological responses modulated by individual susceptibility and lifestyle factors). Diagnostic tools and personalized therapies for atrial cardiomyopathy will be developed.

Unique experimental large-animal models, ongoing patient cohorts and a prospective cohort of MAESTRIA patients will provide rigorous validation of the new biomarkers and tools developed. A dedicated central laboratory will collect and harmonize clinical data. MAESTRIA will be organized as a user-centered platform that is easily accessible via clinical parameters commonly used in European hospitals.

What is the role of Teralab, IMT’s Big Data and AI platform?

AST – The TeraLab team, led by Natalie Cernecka and Luis Pineda, is playing a central role in this project, in three ways. First of all, TeraLab will be involved in making heterogeneous, sensitive health data available for the consortium, while ensuring legal compatibility and security.

Second, TeraLab will build and manage the data hub for the project data, and make this data available to the team of researchers so that they can aggregate and analyze it, and then build a results demonstrator for doctors and patients.

And last but not least, TeraLab will oversee the data management plan or DMP, an essential part of the management of any European project. It is a living document that sets out a plan for managing the data used and generated within the framework of the project. Initiated at the start of the project, this plan is updated periodically to make sure that it still appropriate in light of how the project is progressing. It is even more necessary when it’s a matter of health data management.

Who are the partners for MAESTRIA ?

AST – MAESTRIA is a European consortium of 18 clinicians, scientists and pharmaceutical industry representatives, at the cutting edge of research and medical care for AF and stroke patients. A scientific advisory board including potential clinician users will help MAESTRIA respond to clinical and market needs.

It’s an international project, focused on the EU countries, but certain partners come from England, Canada and the United States. Oxford University, for example, has developed interesting solutions for the processing and aggregation of cardiological data. It is a member of the consortium and we will, of course, be working with its researchers.

We have important French partners such as AP-HP (Assistance Publique-Hôpitaux de Paris, Paris Hospital Authority) involved in data routing and management. The project is coordinated by Sorbonne University.

What are the next big steps for the project?

AST – The MAESTRIA has just been launched, the first big step is making the data available and establishing the legal framework.

Because the data used in this project is heterogeneous – hence the importance of aggregating it – we must understand the specific characteristics of each kind of data (human data, animal data, images, medical files etc.) and adapt our workspaces to users. Since this data is sensitive, security and confidentially challenges are paramount.

Learn more about MAESTRIA

Interview by Véronique Charlet

Data visualization

Understanding data by touching it

Reading and understanding data is not always a simple task. To make it easier, Samuel Huron is developing tools that allow us to handle data physically. The Télécom Paris researcher in data visualization and representation seeks to make complex information understandable to the general public.

Before numbers were used, merchants used clay tokens to perform mathematical operations. These tokens allowed them to represent numerical data in a graphical, physical way, and handle it easily. This kind of token is still used in schools today to help young children become familiar with complex concepts like addition and cardinality. “This very simple tool can open the door to highly complex representations, such as the production of algorithms,” says Samuel Huron, a researcher at Télécom Paris in the fields of data visualization and interactive design.

His work aims to use this kind of simple representation tool to make data understandable to non-experts. “The best way to visualize data is currently programming, but not all of us are computer engineers,” says Samuel Huron. And while providing the entire population with training in programming may be a commendable idea, it is not very realistic. This means that we must trust experts who, despite their best intentions, may provide a subjective interpretation of their observation data.

In an effort to find an alternative, the researcher has taken up the idea of clay tokens. He organizes workshops for people with little or no familiarity with handling data, and proposes using tokens to represent a data set. For example, to represent their monthly budget. Once they have the tokens in their hands, the participants must invent graphical models to represent this data based on what they want to get out of it. “One of the difficult and fundamental things in graphical data analysis is choosing the useful representation for the task, and therefore targeting the visual variables to understand your batch of data,” explains Samuel Huron. “The goal is to teach the participants the concept of visual mapping.”

Video: how does physical representation of data work:

The visualization is not only intended to represent this data, but to develop the capacity to read and make sense of it. Participants must find a way to structure the data themselves. They are then encouraged to think critically by observing the other productions, in particular to see whether they can be read and understood. “In certain workshops with many different data sets, such as the budget of a student, an employed individual, or a retiree, participants can sometimes identify a similar profile just by looking at the representations of other participants,” adds the researcher.

Citizen empowerment 

This transmission method poses real challenges for democracy in our era of digitization of knowledge and the rise of data. To understand the important issues of today and respond to the major challenges we face, we must first understand the data from various fields.  Whether related to budgets, percentage of votes, home energy consumption, or the daily number of Covid-19 cases, all of this knowledge and information is provided in the form of data, either raw or processed to some extent. And to avoid dealing with abstract figures and data, it is represented visually.  Graphs, curves and other diagrams are provided to illustrate this data. But these visual representations are not always understandable to everyone. “In a democracy, we need to understand this data in order to make informed decisions,” says Samuel Huron.

Citizen empowerment is based on the power to make decisions, taking into account complex issues such as climate change or the national budget breakdown. Likewise, to tackle the coronavirus, an understanding of data is required in order to assess risk and implement health measures of varying strictness. It was this societal issue that pushed Samuel Huron to look for data visualization methods that can be used by everyone, with a view to data democratization. This approach includes open data policies and transparency, of course, as well as useful and user-friendly tools that allow everyone to understand and handle this data.

Thinking about the tools

“A distinctive characteristic of human beings is producing representations to process our information,”  says the researcher. “The alphabet is one such example: it’s a graphical encoding to store information that other people can find by reading it.”  Humankind has the capacity to analyze images to quickly identify and examine a set of diagrams, without even thinking at times. These cognitive capacities enable operations in visual space that are otherwise very difficult and allow them to be carried out more quickly than with another kind of encoding, such as numbers.

This is why we tend to illustrate data graphically when we need to explain it. But this is time-consuming and graphs must be updated with each new data set. On the virtual side, there is no shortage of software spreadsheet solutions that allow for dynamic, efficient updates. But they have the drawback of limiting creativity. “Software programs like Excel are great, but all of the possible actions are predefined. Expressiveness of thought is limited by the models offered by the tool,”  says Samuel Huron.

Far from considering tokens to be the ideal solution, the researcher says that they are above all a tool for teaching and raising awareness. “Tokens are a very simple format that make it possible to get started quickly with data visualization, but they remain quite limited in terms of representation,” he says. He is working with his colleagues to develop more complicated workshops with larger data sets that are more difficult to interpret.  In general, these workshops also aim to think about ways to promote the use of data physicalization, with more varied tools and data sets, and therefore more diverse representations. Other studies intend to consider the value of the data rather than that resulting from its handling.

By proposing these data physicalization kits, the researchers can study participants’ thinking. They can therefore better understand how individuals understand, format, handle and interpret data. These observations in turn help the researchers improve their tools and develop new ones that are even more intuitive and user-friendly for different groups of individuals. To go further, the researchers are working on a scientific journal devoted to the topic of data physicalization planned for late 2021. It should  assess the state of the art on this topic, and push research in this area even further. Ultimately, this need to understand digital data may give rise to physical tools to help us grasp complex problems – literally. 

By Tiphaine Claveau.