Reducing the duration of mechanical ventilation with a statistical theory

A team of researchers from IMT Atlantique has developed an algorithm that can automatically detect anomalies in mechanical ventilation by using a new statistical theory. The goal is to improve synchronization between the patient and ventilator, thus reducing the duration of mechanical ventilation and consequently shortening hospital stays. This issue is especially crucial for hospitals under pressure due to numerous patients on respirators as a result of the Covid-19 pandemic.


Dominique Pastor never imagined that the new theoretical approach in statistics he was working on would be used to help doctors provide better care for patients on mechanical ventilation (MV). The researcher in statistics specializes in signal processing, specifically anomaly detection. His work usually focuses on processing radar signals or speech signals. It wasn’t until he met Erwan L’Her, head of emergencies at La Cavale Blanche Hospital in Brest, that he began focusing the application of his theory, called Random Distortion Testing, on mechanical ventilation. The doctor shared a little known problem with the researcher, which would become a source of inspiration: a mismatch that often exists between patients’ efforts while undergoing MV and the respirator’s output.

Signal anomalies with serious consequences

Respirators–or ventilators–feature a device enabling them to supply pressurized air when they recognize demand from the patient. In other words, the patient is the one to initiate a cycle. Many adjustable parameters are used to best respond to an individual’s specific needs, which change as the illness progresses. These include inspiratory flow rate and number of cycles per minute. Standard settings are used at the start of MV and then modified based on flow rate/ pressure curves–the famous signal processed by the Curvex algorithm, which resulted from collaboration between Dominique Pastor and Erwan L’Her.

Patient-ventilator asynchronies are defined as time lags between the patient’s inspiration and the ventilator’s flow rate. For example, the device cannot detect a patient’s demand for air because the trigger threshold level is set too high. This leads to ineffective inspiratory effort. It can also lead to double triggering when the ventilator generates two cycles for one patient inspiratory effort. The patient may also not have time to completely empty their lungs before the respirator begins a new cycle, leading to dynamic hyperinflation of the lungs, also known as intrinsic PEEP (positive end-expiratory pressure).

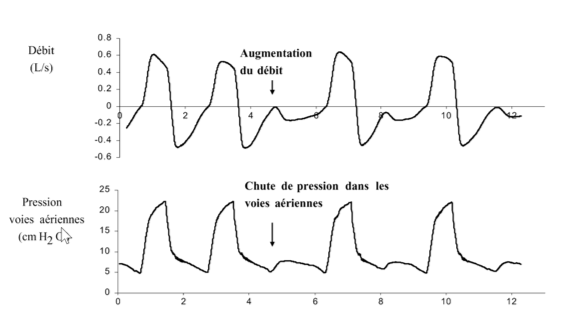
Effort inspiratoire inefficace : la demande du patient n’aboutit pas à une insufflation

Example of ineffective inspiratory effort: patient demand does not result in insufflation.


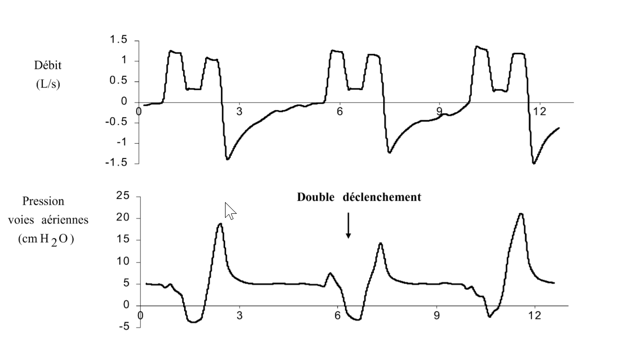
Double déclenchement : un seul effort inspiratoire aboutit à deux insufflations rapprochées

Example of double triggering: a single inspiratory effort results in two ventilator insufflations within a short time span.


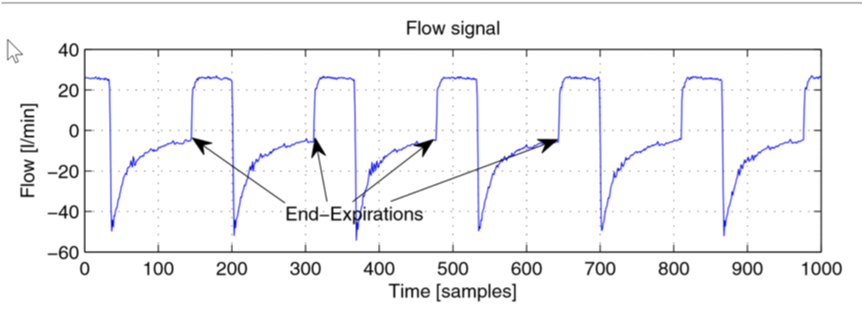
PEP intrinsèque : l’insufflation suivante survient alors que le débit n’est pas nul à la fin de l’expiration

Example of positive end expiratory pressure: the next ventilator insufflation occurs before the flow has returned to zero at the end of expiration.


These patient-ventilator anomalies are believed to be very common in clinical practice. They have serious consequences, ranging from patient discomfort to increased respiratory efforts that can lead to invasive ventilation–intubation. They involve an increase in the duration of mechanical ventilation, with an increase in weaning failure (end of MV) and therefore longer hospital stays.

However, the number of patients in need of mechanical ventilation has skyrocketed with the Covid-19 pandemic, while the number of health care workers, respirators and beds has only moderately increased, which at times gives rise to difficult ethical choices. A reduction in the duration of ventilation would therefore be a significant advantage, both for the current situation and in general, since respiratory diseases are becoming increasingly common, especially with the aging of the population.

A statistical model that adapts to various signals

Patient-ventilator asynchronies result in visible anomalies in air flow rate and pressure curves. These curves model the series of inspiratory phases, when pressure increases and expiratory phases, when it decreases, with inversion of the air flow. Control monitors for most next-generation devices display these flow rate and pressure curves. The anomalies are visible to the naked eye, but this requires regular monitoring of the curves, and a doctor to be present who can adjust the ventilator settings. Dominique Pastor and Erwan L’Her had a common objective: develop an algorithm that would detect certain anomalies automatically. Their work was patented under the name Curvex in 2013.

The detection of an anomaly represents a major deviation from the usual form for a signal. We chose an approach called supervised learning by mathematical modeling,” Dominique Pastor explains. One characteristic of his Random Distorsion Testing theory is that it makes it possible to detect signal anomalies with very little prior knowledge. “Often, the signal to be processed is not well known, as in the case of MV, since each patient has unique characteristics, and it is difficult to obtain a large quantity of medical data. The usual statistical theories have difficulty taking into account a high degree of uncertainty in the signal. Our model, on the other hand, is generic and flexible enough to handle a wide range of situations.” 

Dominique Pastor first worked with intrinsic PEEP detection algorithms with PhD student Quang-Thang Nguyen, who helped to find solutions. “The algorithm is a flow rate signal segmentation method used to identify the various breathing phases and calculate models for detecting anomalies. We introduced an adjustable setting (tolerance) to define the deviation from the model used to determine whether it is an anomaly,” Dominique Pastor explains. According to the researcher from IMT Atlantique, this tolerance is a valuable asset. It can be adjusted by the user, based on their needs, to alter the sensitivity and specificity.

The Curvex platform not only processes flow data from ventilators, but also a wide range of physiological signals (electrocardiogram, electroencephalogram). A ventilation simulator was included, with settings that can be adjusted in real-time, in order to test the algorithms and perform demonstrations. By modifying certain pulmonary parameters (compliance, airway resistance, etc.) and background noise levels, different signal anomalies (intrinsic PEEP, ineffective inspiratory effort, etc.) appear randomly. The algorithm detects and characterizes them. “In terms of methodology, it is important to have statistical signals that we can control in order to make sure it is working and then move on to real signals,” Dominique Pastor explains.

The next step is to create a proof of concept (POC) by developing electronics to detect anomalies in ventilatory signals, to be installed in emergency and intensive care units and used by health care providers. The goal is to provide versatile equipment that could adapt to any ventilator. “The theory has been expanding since 2013, but unfortunately the project has made little progress from a technical perspective due to lack of funding.  We now hope that it will finally materialize, in partnership with a laboratory, or designers of ventilators, for example. I think this a valuable use of our algorithms, both from a scientific and medical perspective,” says Dominique Pastor.

By Sarah Balfagon for I’MTech.

Learn more:

– Mechanical ventilation system monitoring: automatic detection of dynamic hyperinflation and asynchrony. Quang-Thang Nguyen, Dominique Pastor, François Lellouche and Erwan L’Her

Illustration sources:

Curves 1 and 2

Curve 3


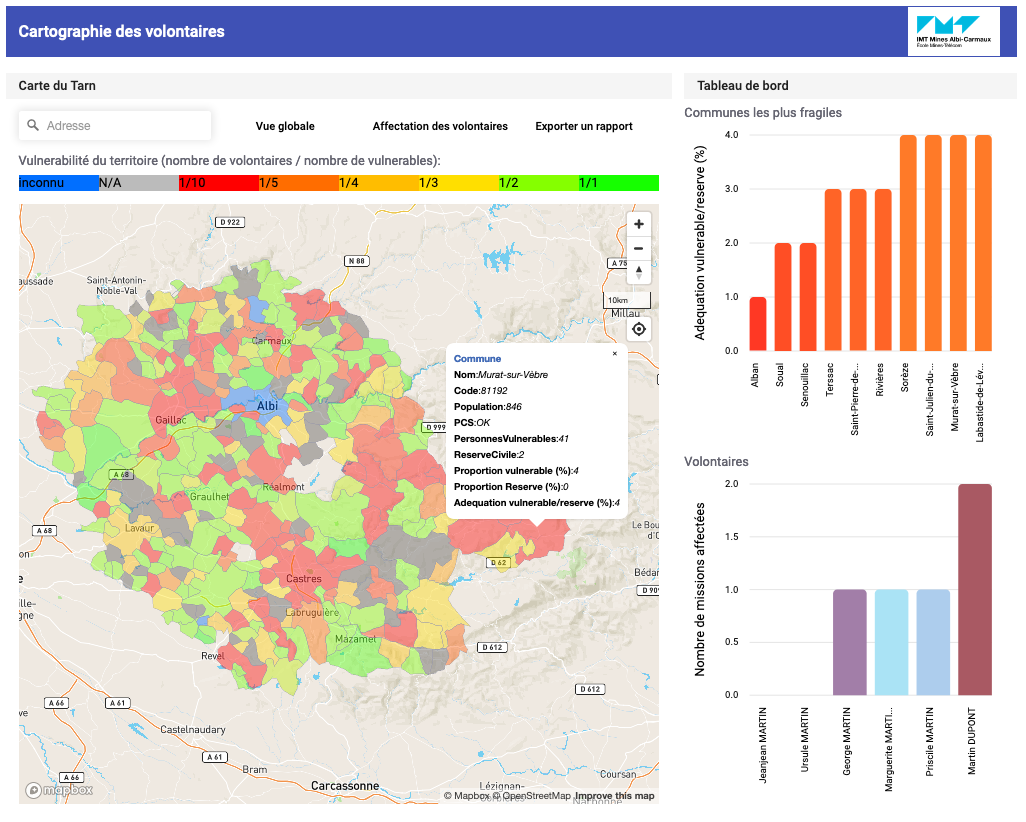
Capture d'écran des cartes du Tarn pour visualiser l'épidémie de Covid-19, crisis management

Covid-19 crisis management maps

The prefecture of the Tarn department worked with a research team from IMT Mines Albi to meet their needs in managing the Covid-19 crisis. Frédérick Benaben, an industrial engineering researcher, explains the tool they developed to help local stakeholders visualize the necessary information and facilitate their decision-making.


The Covid-19 crisis is original and new, because it is above all an information crisis,” says Frédérick Benaben, a researcher in information system interoperability at IMT Mines Albi. Usually, crisis management involves complex organization to get different stakeholders to work together. This has not been the case in the current health crisis. The difficulty here lies in obtaining information: it is important to know who is sick, where the sick people are and where the resources are. The algorithmic crisis management tools that Frédérick Benaben’s team have been working on are thus incompatible with current needs.

When we were contacted by the Tarn prefecture to provide them with a crisis management tool, we had to start almost from scratch,” says the researcher. This crisis is not so complex in its management that it requires the help of artificial intelligence, but it is so widespread that it is difficult to display all the information at once. The researchers therefore worked on using a tool that ensures both the demographic visualization of the territory and the optimization of volunteer workers’ routes.

The Tarn team was able to make this tool available quickly and thus save a considerable amount of time for stakeholders in the territory. The success of this project also lies in the cohesion at the territorial level between a research establishment and local stakeholders, reacting quickly and effectively to an unprecedented crisis. The prefecture wanted to work on maps to visualize the needs and resources of the department, and that is what Frédérick Benaben and his colleagues, Aurélie Montarnal, Julien Lesbegueries and Guillaume Martin provided them with.

Visualizing the department

The first requirement was to be able to visualize the needs of the municipalities in the department. It was then necessary to identify the people most at risk of being affected by the disease. Researchers drew on INSEE’s public data to pool information such as age or population density. “The aim was to divide the territory into municipalities and cantons in order to diagnose fragility on a local scale,” explains Frédérick Benaben. For example, there are greater risks for municipalities whose residents are mostly over 65 years of age.

The researchers therefore created a map of the department with several layers that can be activated to visualize the different information. One showing the fragility of the municipalities, another indicating the resilience of the territory – based, for example, on the number of volunteers. By identifying themselves on the prefecture’s website, these people volunteer to go shopping for others, or simply to keep in touch or check on residents. “We can then see the relationship between the number of people at risk and the number of volunteers in a town, to see if the town has sufficient resources to respond,” says the researcher.

Some towns with a lot of volunteers appear mostly in green, those with a lack of volunteers are very red. “This gives us a representation of the Tarn as a sort of paving with red and green tiles, the aim being to create a uniform color by associating the surplus volunteers with those municipalities which need them” specifies Frédérick Benaben.

This territorial visualization tool offers a simple and clear view to local stakeholders to diagnose the needs of their towns. With this information in hand it is easier for them to make decisions to prepare or react. “If a territory is red, we know that the situation will be difficult when the virus hits,” says the researcher. The prefecture can then allocate resources for one of these territories, for example by requisitioning premises if there is no emergency center in the vicinity. It may also include decisions on communication, such as a call for volunteers.

Optimizing routes

This dynamic map is continuously updated with new data, such as the registration of new volunteers. “There is a very contemplative aspect and a more dynamic aspect that optimizes the routes of volunteers,” says Frédérick Benaben. There are many parameters to be taken into account when deciding on routes and this can be a real headache for the employees of the prefecture. Moreover, these volunteer routes must also be designed to limit the spread of the epidemic.

The needs of people who are ill or at risk must be matched with the skills of the volunteers. Some residents ask for help with errands or gardening, but others also need medical care or help with personal hygiene that requires special skills. It is also necessary to take into account the ability of volunteers to travel, whether by vehicle, bicycle or on foot. With regard to Covid-19, it is also essential to limit contact and reduce the perimeter of the routes as much as possible.

With this information, we can develop an algorithm to optimize each volunteer’s routes,” says the researcher. This is of course personal data to which the researchers do not have access. They have tested the algorithm with fictitious values to ensure functionality when the prefecture enters the real data.

The interest of this mapping solution lies in the possibilities for development,” says Frédérick Benaben. Depending on the available data, new visualization layers can be added. “Currently we have little or no data on those who are contaminated or at risk of dangerous contamination and remain at home. If we had this data we could add a new layer of visualization and provide additional support for decision making. We can configure as many layers of visualizations as we want.

 Tiphaine Claveau for I’MTech

Gaia-X

Gaia-X: a sovereign, interoperable European cloud network

France and Germany have unveiled the Gaia-X project, which aims to harmonize cloud services in Europe to facilitate data sharing between different parties. It also seeks to reduce companies’ dependence on cloud service providers, which are largely American. For Europe, this project is therefore an opportunity to regain sovereignty over its data.


When a company chooses a cloud service provider, it’s a little bit like when you accept terms of service or sale: you never really know how you’ll be able to change your service or how much it will cost.” Anne-Sophie Taillandier uses this analogy to illustrate the challenges companies currently face in relying on cloud service providers. As director of IMT’s TeraLab platform specializing in data analysis and AI, she is contributing to the European Gaia-X project, which aims to introduce transparency and interoperability in cloud services in Europe.

Initiated by German Economy Minister Peter Altmaier, Gaia-X currently brings together ten German founding members and ten French founding members, including cloud service providers and major users of these services, of all sizes and from all industries. Along with these companies, a handful of academic players specialized in research in digital science and technology – including IMT – are also taking part in the project. This public-private consortium is seeking to develop two types of standards to harmonize European cloud services.

First of all, it aims to introduce technical standards to harmonize practices among various players. This is an important condition to facilitate data and software portability. Each company must be able to decide to switch service providers if it so wishes, without having to modify its databases to make them compatible with a new service. The standardization of the technical framework for every cloud service is a key driver to facilitate the movement of data between European parties.

Environmental issues illustrate the significance of this technical problem. “In order to measure the environmental impact of a company’s operations, its data must be combined with that of its providers, and possibly, its customers,” explains Anne-Sophie Taillandier, who, for a number of years, has been leading research at TeraLab into the issues of data transparency and portability. “If each party’s data is hosted on a different service, with its own storage and processing architecture, they will first have to go through a lengthy process in order to harmonize the data spaces.”  This step is currently a barrier for organizations that lack either financial resources or skills, such as small companies and public organizations.

Also read on I’MTech: Data sharing: an important issue for the agricultural sector

In addition to technical standards, the members of the Gaia-X partnership are also seeking to develop a regulatory and ethical framework for cloud service stakeholders in Europe. The goal is to bring clarity to contractual relationships between service providers and customers. “SMEs don’t have the same legal and technical teams as large companies,” says Anne-Sophie Taillandier. “When they enter into an agreement with a cloud service provider, they don’t have the resources to evaluate all the subtleties of the contract.”

The consortium has already begun to work on these ethical rules.  For example, there must not be any hidden costs when a company wishes to remove its data from a service provider and switch to another provider. Ultimately, this part of the project should give companies the power to choose their cloud service providers in a transparent way. An approach that recalls the GDPR, which gives citizens the ability to choose their digital services with greater transparency and to ensure the portability of their personal data when necessary.

Restoring European digital sovereignty

It is no coincidence that the concepts guiding the Gaia-X project evoke those of the GDPR. Gaia-X is rooted in a general European Union trend for data sovereignty.  The initiative is also an integral part of the long-term EU strategy to create a sovereign space for industrial and personal data, protected by technical and legal mechanisms, which are also sovereign.

The Cloud Act adopted by the United States in 2018 gave rise to concerns among European  stakeholders. This federal law gives local and national law enforcement authorities the power to request access to data stored by American companies, should this data be necessary to a criminal investigation, including when these companies’ servers are located outside the United States. Yet, the cloud services market is dominated by American players. Together, Amazon, Microsoft and Google have over half the market share for this industry. For European companies, the Cloud Act poses a risk to the sovereignty of their data.

Even so, the project does not aim to create a new European cloud services leader, but rather to encourage the development of existing players, through its regulations and standards, while harmonizing the practices already in place among the various players. The goal is not to prevent American players or those in other countries — Chinese giant Alibaba’s cloud service is increasingly gaining ground ­— from tapping into the European market. “Our goal is to issue standards that respect European values, and then tell anyone who wishes to enter the European market that they may, as long as they play by the rules.”

For now, Gaia-X has adopted an associative structure. In the months ahead, the consortium should be opening up to incorporate other European companies who want to take part. “The project was originally a Franco-German initiative,” says Anne-Sophie Taillandier, “but it is meant to open up to include other European players who wish to contribute.” In line with European efforts over recent years to develop digital technology with a focus on cybersecurity and artificial intelligence, Gaia-X and its vision for a European cloud will rely on joint creation.


Benjamin Vignard for I’MTech