consent, consentement

GDPR: managing consent with the blockchain?

Blockchain and GDPR: two of the most-discussed keywords in the digital sector in recent months and years. At Télécom SudParis, Maryline Laurent has decided to bring the two together. Her research focuses on using the blockchain to manage consent to personal data processing.


The GDPR has come into force at last! Six years have gone by since the European Commission first proposed reviewing the personal data protection rules. The European regulation, which came into force in April 2016, was closely studied by companies for over two years in order to ensure compliance by the 25 May 2018 deadline. Of the 99 articles that make up the GDPR, the seventh is especially important for customers and users of digital services. It specifies that any request for consent “must be presented in a manner which is clearly distinguishable from the other matters, in an intelligigble and easily accessible form, using clear and plain language.” Moreover, any company (known as a data controller) responsible for processing customers’ personal data “shall be able to demonstrate that consent was given by the data subject to the processing of their personal data.”

Although these principles seem straightforward, they introduce significant constraints for companies. Fulfilling both of these principles (transparency and accounting) is not an easy task. Maryline Laurent, a researcher at Télécom SudParis with network security expertise, is tackling this problem. As part of her work for IMT’s Personal Data Values and Policies Chair — of which she is the co-founder — she has worked on a solution based on the blockchain in a B2C environment1. The approach relies on smart contracts recorded in public blockchains such as Ethereum.

Maryline Laurent describes the beginning of the consent process that she and her team have designed between a customer and a service provider: “The customer contacts the company through and authenticated channel and receives a request from the service provider containing the elements of consent that shall be proportionate to the provided service.” Based on this request, customers can prepare a smart contract to specify information for which they agree to authorize data processing. “They then create this contract in the blockchain, which notifies the service provider of the arrival of a new consent,” continues the researcher. The company verifies that this corresponds to its expectations and signs the contract. In this way, the fact that the two parties have approved the contract is permanently recorded in a block of the chain. Once the customer has made sure that everything has been properly carried out, he may provide his data. All subsequent processing of this data will also be recorded in the blockchain by the service provider.
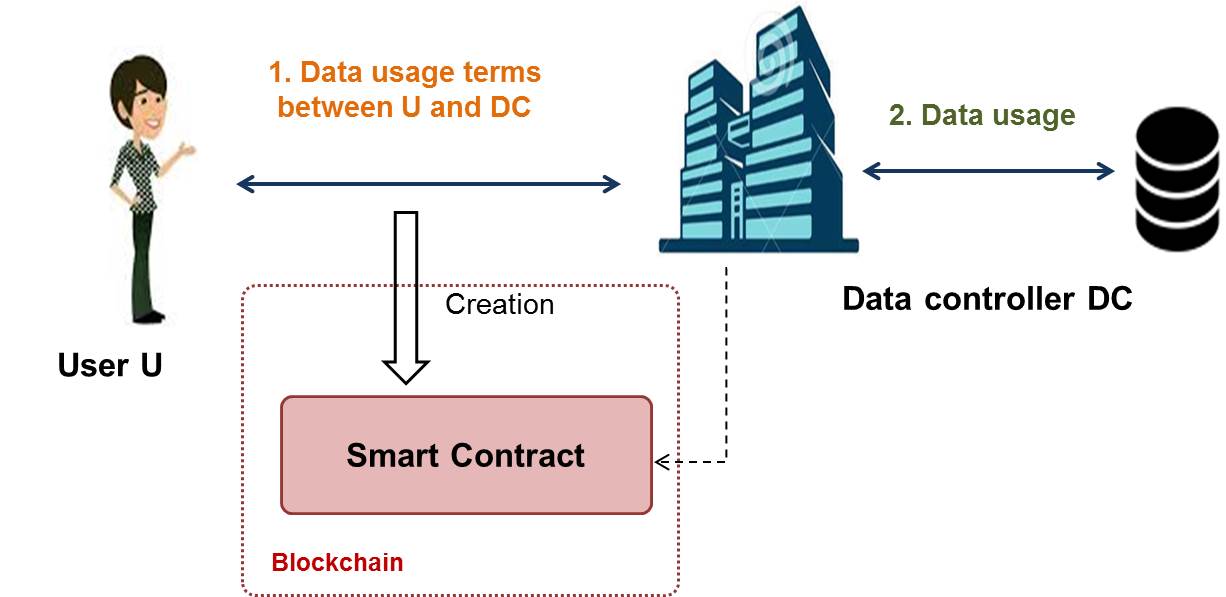
 

A smart contract approved by the Data Controller and User to record consent in the blockchain


A smart contract approved by the Data Controller and User to record consent in the blockchainSuch a solution allows users to understand what they have consented to. Since they write the contract themselves, they have direct control over which uses of their data they accept. The process also ensures multiple levels of security. “We have added a cryptographic dimension specific to the work we are carrying out,” explains Maryline Laurent. When the smart contract is generated, it is accompanied by some cryptographic material that makes it appear to the public as user-independent. This makes it impossible to link the customer of the service and the contract recorded in the blockchain, which protects its interests.

Furthermore, personal data is never entered directly in the blockchain. To prevent the risk of identity theft, “a hash function is applied to personal data,” says the researcher. This function calculates a fingerprint over the data that makes it impossible to trace back. This hashed data is then recorded in the register, allowing customers to monitor the processing of their data without fear of an external attack.


Facilitating audits

This solution is not only advantageous for customers. Companies also benefit from the use of consent based on the blockchain. Due to the transparency of public registers and the unalterable time-stamped registration that defines the blockchain, service providers can comply with the auditing need. Article 24 of the GDPR requires the data controller to “implement appropriate technical and organizational measures to ensure and be able to demonstrate that the  processing of personal data is performed in compliance with this Regulation.” In short, companies must be able to provide proof of compliance with consent requirements for their customers.

There are two types of audits,” explains Maryline Laurent. “A private audit is carried out by a third-party organization that decides to verify a service provider’s compliance with the GDPR.” In this case, the company can provide the organization with all the consent documents recorded in the blockchain, along with the associated operations. A public audit, on the other hand, is carried out to ensure that there is sufficient transparency for anyone to verify that everything appears to be in compliance from the outside. “For security reasons, of course, the public only has a partial view, but that is enough to detect major irregularities,” says the Télécom SudParis researcher. For example, any user may ensure that once he/she has revoked consent, no further processing is performed on the data concerned.

In the solution studied by the researchers, customers are relatively familiar with the use of the blockchain. They are not necessarily experts, but must nevertheless use software that allows them to interface with the public register. The team is already working on blockchain solutions in which customers would be less involved. “Our new work2 has been presented in San Francisco at the 2018 IEEE 11th Conference on Cloud Computing, which hold from 2 to 7 July 2018. It makes the customer peripheral to the process and instead involves two service providers in a B2B relationship,” explains Maryline Laurent. This system better fits a B2B relationship when a data controller outsources data to a data processor and enables consent transfer to the data processor. “Customers would no longer have any interaction with the blockchain, and would go through an intermediary that would take care of recording all the consent elements.”

Between applications for customers and those for companies, this work paves the way for using the blockchain for personal data protection. Although the GDPR has come into force, it will take several months for companies to become 100% compliant. Using the blockchain could therefore be a potential solution to consider. At Télécom SudParis, this work has contributed to “thinking about how the blockchain can be used in a new context, for the regulation,” and is backed up by the solution prototypes. Maryline Laurent’s goal is to continue this line of thinking by identifying how software can be used to automate the way GDPR is taken into account by companies.


1 N. Kaâniche, M. Laurent, “A blockchain-based data usage auditing architecture with enhanced privacy and availability“, The 16th IEEE International Symposium ong Network Computing and Applications, NCA 2017, ISBN: 978-1-5386-1465-5/17, Cambridge, MA USA, 30 Oct. 2017-1 Nov. 2017.

N. Kaâniche, M. Laurent, “BDUA: Blockchain-based Data Usage Auditing“, IEEE 11th Conference on Cloud Computing, San Francisco, CA, USA, 2-7 July 2018

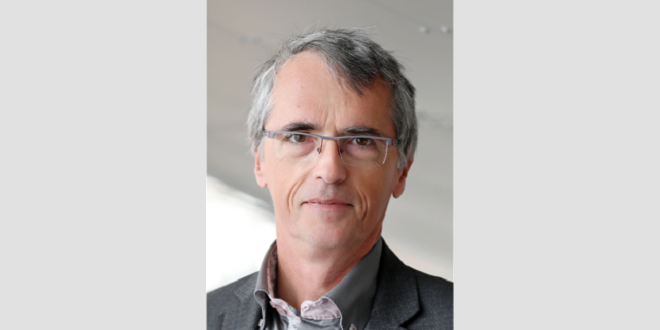
Jacques Fages

IMT Mines Albi | Supercritical fluids, CO2, Process Engineering, Biotechnology

Jacques Fages has been a professor since 1996 at IMT Mines Albi in the RAPSODEE research centre (UMR CNRS 5302) where he served as the director from 2005 to 2008. He graduated from INSA Toulouse (1979) as a biochemical engineer and obtained his HDR (French academic degree to become a university professor) in 1993. He used to be a research engineer in various industrial companies for 14 years before joining IMT Mines Albi. Its research themes focus on processes using supercritical CO2 in a green engineering context. Several industrial processes in the fields of pharmacy or medicine stem directly from the work of his team. He chaired the ISASF, a learned society that organizes most of the world’s supercritical fluid congresses. He is the inventor of more than 15 patents and has authored more than one hundred scientific publications.

[toggle title=”Find here his articles on I’MTech” state=”open”]

[/toggle]

supercritical fluid

What is a supercritical fluid?

Water, like any chemical substance, can exist in a gaseous, liquid or solid state… but that’s not all! When sufficiently heated and pressurized, it becomes a supercritical fluid, halfway between a liquid and a gas. Jacques Fages, a researcher in process engineering, biochemistry and biotechnology at IMT Mines Albi, answers our questions on these fluids which, among other things, can be used to replace polluting industrial solvents or dispose of toxic waste. 


What is a supercritical fluid?

Jacques Fages: A supercritical fluid is a chemical compound maintained above its critical point, which is defined by a specific temperature and pressure. The critical pressure of water, for example, is the pressure beyond which it can be heated to over 100°C without becoming a gas. Similarly, the critical temperature of CO2 is the temperature beyond which it can be pressurized without liquefying. When the critical temperature and pressure of a substance are exceeded at the same time, it enters the supercritical state. Unable to liquefy completely under the effect of temperature, but also unable to gasify completely under the effect of pressure, the substance is maintained in a physical state between a liquid and a solid: its density will be equivalent to that of a liquid, but its fluidity will be that of a gas.

For CO2, which is the most commonly used fluid in supercritical state, the critical temperature and pressure are relatively low: 31°C and 74 bars, or 73 times atmospheric pressure. Because CO2 is also an inert molecule, inexpensive, natural and non-toxic, it is used in 90% of applications. The critical point of water is much higher: 374°C and 221 bars respectively. Other molecules such as hydrocarbons can also be used, but their applications remain much more marginal due to risks of explosion and pollution.

What are the properties of supercritical CO2 and the resulting applications?

JF: Supercritical CO2 is a very good solvent because its density is similar to that of a liquid, but it has much greater fluidity – similar to that of a gas – which allows it to penetrate the micropores of a material. The supercritical fluid can selectively extract molecules, it can also be used for particle design.

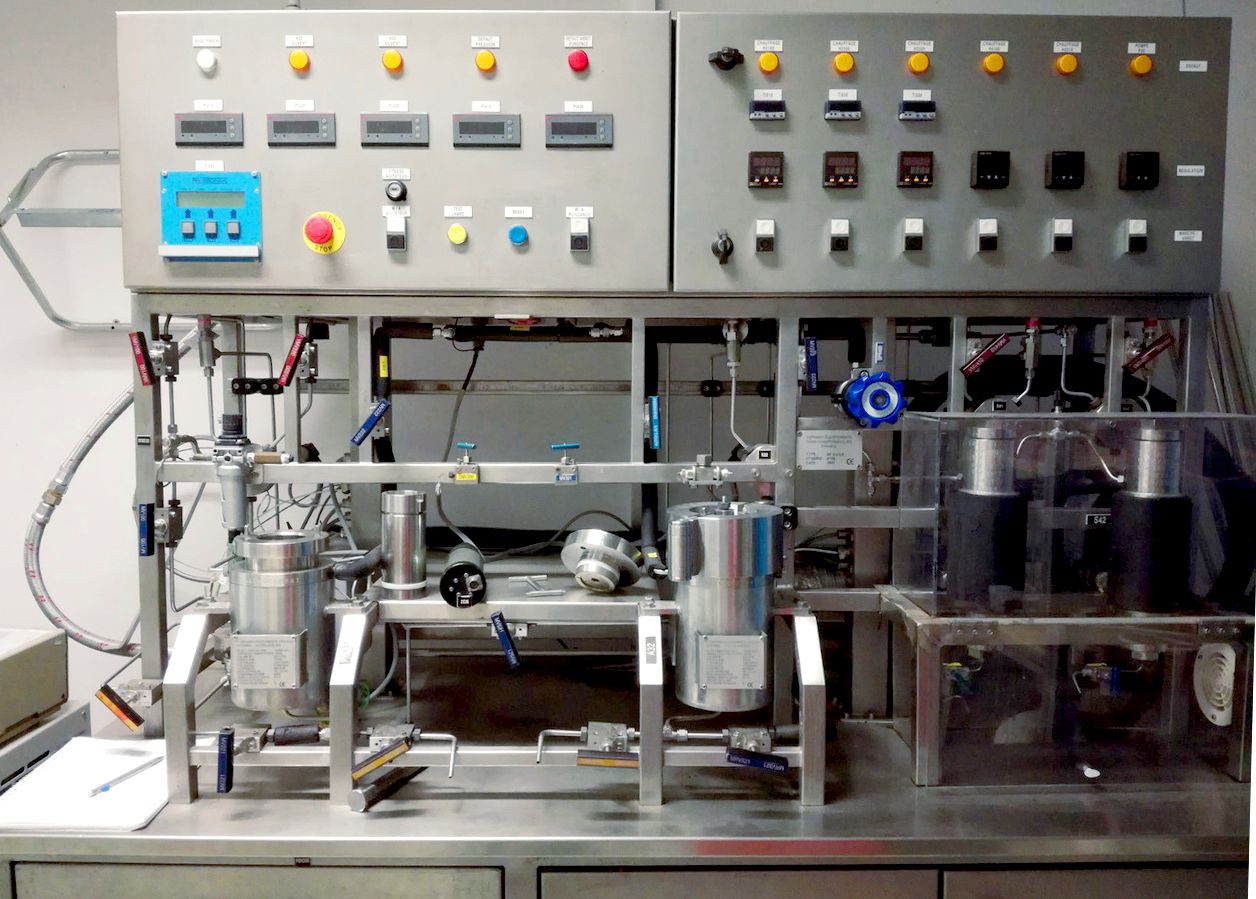
A device designed for implementing extraction and micronization processes of powders.


Supercritical CO2 can be used to clean medical devices, such as prostheses, in addition to the sterilization methods used. It removes all the impurities to obtain a product that is clean enough to be implanted in the human body. It is a very useful complement to current methods of sterilization. In pharmacy, it allows us to improve the bioavailability of certain active principles by improving their solubility or speed of dissolution. At IMT Mines Albi, we worked on this type of process for Pierre Fabre laboratories, allowing the company to develop its own research center on supercritical fluids.

Supercritical CO2 has applications in many sectors such as materials, construction, biomedical healthcare, pharmacy and agri-food as well as the industry of flavorings, fragrances and essential oils. It can extract chemical compounds without the use of solvents, guaranteeing a high level of purity.

Can supercritical CO2 be used to replace the use of polluting solvents?

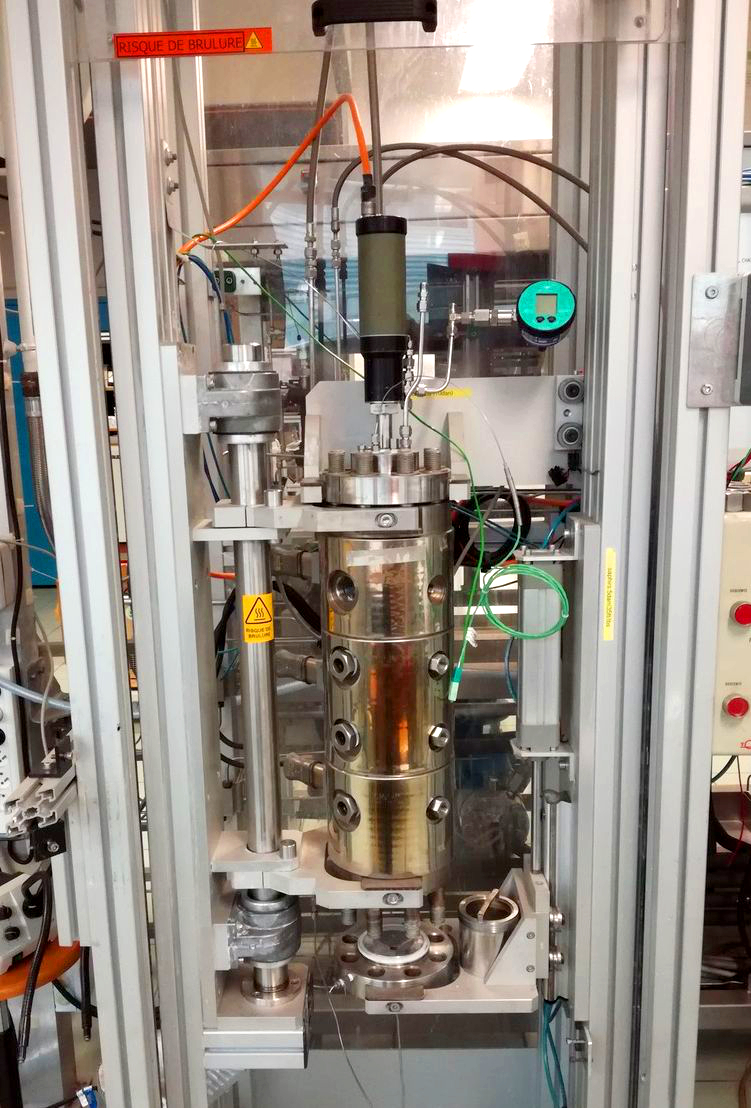
JF: Yes, supercritical CO2 can replace existing and often polluting organic solvents in many fields of application and prevents the release of harmful products into the environment. For example, manufacturers currently use large quantities of water for dyeing textiles, which must be retreated after use because it has been polluted by pigments. Dyeing processes using supercritical CO2 allow textiles to be dyed without the release of chemicals. Rolls of fabric are placed in an autoclave, a sort of large pressure cooker designed to withstand high pressures, which pressurizes and heats the CO2 to its critical state. Once dissolved in the supercritical fluid, the pigment permeates to the core of the rolls of fabric, even those measuring two meters in diameter! The CO2 is then restored to normal atmospheric pressure and the dye is deposited on the fabric while the pure gas returns into the atmosphere or, better still, is recycled for another process.

But, watch out! We are often criticized for releasing CO2 into the atmosphere and thus contributing to global warming. This is not true: we use CO2 that has already been generated by an industry. We therefore don’t actually produce any and don’t increase the amount of CO2 in the atmosphere.

Does supercritical water also have specific characteristics?

JF: Supercritical water can be used for destroying hazardous, toxic or corrosive waste in several industries. Supercritical H2O is a very powerful oxidizing environment in which organic molecules are rapidly degraded. This fluid is also used in biorefinery: it gasifies or liquefies plant residues, sawdust or cereal straw to transform them into liquid biofuel, or methane and hydrogen gases which can be used to generate power. These solutions are still in the research stage, but have potential large-scale applications in the power industry.

Are supercritical fluids used on an industrial scale?

JF: Supercritical CO2 is not an oddity found only in laboratories! It has become an industrial process used in many fields. A French company called Diam Bouchage, for example, uses supercritical CO2 to extract trichloroanisole, the molecule responsible for cork taint in wine. It is a real commercial success!

Nevertheless, this remains a relatively young field of research that only developed in the 1990s. The scope for progress in the area remains vast! The editorial committee of the Journal of Supercritical Fluids, of which I am a member, sees the development of new applications every year.


Earth

Will the earth stop rotating after August 1st?

By Natacha Gondran, researcher at Mines Saint-Étienne, and Aurélien Boutaud.
The original version of this article (in French) was published in The Conversation.

[divider style=”normal” top=”20″ bottom=”20″]

[dropcap]I[/dropcap]t has become an annual summer tradition, much like France’s Music Festival or the Tour de France. Every August, right when French people are focused on enjoying their vacation, an alarming story begins to spread through the news: it’s Earth Overshoot Day!

From this fateful date through to the end of the year, humanity will be living at nature’s expense as it runs up an ecological debt. Just imagine vacationers on the beach or at their campsite discovering, through the magic of mobile networks, the news of this imminent breakdown.

Will the earth cease to rotate after August 1st? The answer is… No. There is no need to panic (well, not quite yet.) Once again, this year, the Earth will continue to rotate even after Earth Overshoot Day has come and gone. In the meantime, let’s take a closer look at how this date is calculated and how much it is worth from a scientific standpoint.

Is the ecological footprint serious?

Earth Overshoot Day is calculated based on the results of the “ecological footprint”, an indicator invented in the early 1990s by two researchers from the University of British Columbia in Vancouver. Mathis Wackernagel and William Rees sought to develop a synoptic tool that would measure the toll of human activity on the biosphere. They then thought of estimating the surface area of the land and the sea that would be required to meet humanity’s needs.

More specifically, the ecological footprint measures two things: on the one hand, the biologically productive surface area required to produce certain renewable resources (food, textile fibers and other biomass); on the other, the surface area that should be available to sequester certain pollutants in the biosphere.

In the early 2000s the concept proved extremely successful, with a vast number of research articles published on the subject, which contributed to making the calculation of the ecological footprint more robust and detailed.

Today, based on hundreds of statistical data entries, the NGO Global Footprint Network estimates humanity’s ecological footprint at approximately 2.7 hectares per capita. However, this global average conceals huge disparities: while an American’s ecological footprint exceeds 8 hectares, that of an Afghan is less than 1 hectare.

Overconsumption of resources

It goes without saying: the Earth’s biologically productive surfaces are finite. This is what makes the comparison between humanity’s ecological footprint and the planet’s biocapacity so relevant. This biocapacity represents approximately 12 billion hectares (of forests, cultivated fields, pasture land and fishing areas), or an average of 1.7 hectares per capita in 2012.

The comparison between ecological footprint and biocapacity therefore results in this undeniable fact: each year, humanity consumes more services from the biosphere that it can regenerate. In fact, it would take one and a half planets to sustainably provide for humanity’s needs. In other words, by August, humanity has already consumed the equivalent of the world’s biocapacity for one world.

These calculations are what led to the famous Earth Overshoot Day.

Legitimate Criticism

Of course, the ecological footprint is not immune to criticism. One criticism is that it focuses its analysis on the living portion of natural capital only and fails to include numerous issues, such as the pressure on mineral resources and chemical and nuclear pollution.

The accounting system for the ecological footprint is also very anthropocentric: biocapacity is estimated based on the principle that natural surfaces are at humanity’s complete disposal, ignoring the threats that human exploitation of ecosystems can pose for biodiversity.

Yet most criticism is aimed at the way the ecological footprint of fossil fuels is calculated. In fact, those who designed the ecological footprint based the concept on the observation that fossil fuels were a sort of “canned” photosynthetic energy–since they resulted from the transformation of organic matter that decomposed millions of years ago. The combustion of this matter therefore amounts to transferring carbon of organic origin into the atmosphere. In theory, this carbon could be sequestered in the biosphere… If only the biological carbon sinks were sufficient.

Therefore, what the ecological footprint measures is in fact a “phantom surface” of the biosphere that would be required to sequester the carbon that is accumulating in the atmosphere and causing the climate change we experience. This methodological discovery makes it possible to transfer tons of CO₂ into “sequestration surfaces”, which can then be added to the “production surfaces”.

While this is a clever principle, it poses two problems: first, almost the entire deficit observed by the ecological footprint is linked to the combustion of fossil fuels; and second, the choice of the coefficient between tons of CO₂ and sequestration surfaces is questionable, since several different hypotheses can produce significantly different results..

Is the ecological deficit underestimated?

Most of this criticism was anticipated by the designers of the ecological footprint.

Based on the principle that “everything simple is false, everything complex is unusable” (Paul Valéry), they opted for methodological choices that would produce aggregated results that could be understood by the average citizen. However, it should be noted that, for the most part, these choices were made to ensure that the ecological deficit was not overestimated. Therefore, a more rigorous or more exhaustive calculation would result in the increase of the observed deficit… And thus, an even earlier “celebration” of Earth Overshoot Day.

Finally, it is worth noting that this observation of an ecological overshoot is now widely confirmed by another scientific community which has, for the past ten years, worked in more detail on the “planetary boundaries” concept.

This work revealed nine areas of concern which represent ecological thresholds beyond which the conditions of life on Earth could no longer be guaranteed, since we would be leaving the stable state that has characterized the planet’s ecosystem for 10,000 years.

For three of these issues, it appears the limits have already been exceeded: the species’ extinction rate, and the balance of the biogeochemical cycle of nitrogen and that of phosphorus. We are also dangerously close to the thresholds in the areas of climate change and the use of land surface. In addition, we cannot rule out the possibility of new causes for concern arising in the future.

Earth Overshoot Day is therefore worthy of our attention, since it reminds us of this inescapable reality: we are exceeding several of our planet’s ecological limits. Humanity must take this reality more seriously. Otherwise, the Earth might someday continue to rotate… but without us.


[divider style=”normal” top=”20″ bottom=”20″]

Aurélien Boutaud and Natacha Gondran co-authored « L’empreinte écologique » (éditions La Découverte, 2018).

aneurysm

A digital twin of the aorta to prevent aneurysm rupture

15,000 Europeans die each year from rupture of an aneurysm in the aorta. Stéphane Avril and his team at Mines Saint-Étienne are working to better prevent this. To do so, they develop a digital twin of the artery of a patient with an aneurysm. This 3D model makes it possible to simulate the evolution of an aneurysm over time, and better predict the effect of a surgically-implanted prosthesis. Stéphane Avril talks to us about this biomechanics research project and reviews the causes for this pathology along with the current state of knowledge on aneurysms.


Your research focuses on the pathologies of the aorta and aneurysm rupture in particular. Could you explain how this occurs?   

Stéphane Avril

Stéphane Avril: The aorta is the largest artery in our body. It leaves the heart and distributes blood to the arms and brain, goes back down to supply blood to the intestines and then divides in two to supply blood to the legs. The wall of the aorta is a little bit like our skin. It is composed of practically the same proteins and the tissues are very similar. It therefore becomes looser as we age. This phenomenon may be accelerated by other factors such as tobacco or alcohol. It is an irreversible process that results in an enlarged diameter of the artery. When there is significant dilation, it is called an aneurysm. This is the most common pathology of the aorta. The aneurysm can rupture, which is often lethal for the individual. In Europe, some 15,000 people die each year from a ruptured aneurysm.

Can the appearance of an aneurysm be predicted?

SA: No, it’s very difficult to predict where and when an aneurysm will appear. Certain factors are morphological. For example, some aneurysms result from the malformation of an aortic valve: 1 % of the population has only two of the three leaflets that make up this part of the heart. As a result, the blood is pumped irregularly, which leads to a microinjury on the wall of the aorta, making it more prone to damage. One out of two individuals with this malformation develops an aneurysm, usually between the ages of 40 and 60. There are also genetic factors that lead to aneurysms earlier in life, between the ages 20 and 40. Then there are the effects of ageing, which make populations over 60 more likely to develop this pathology. It is complicated to determine which factors predominate in relation to one another. Especially since if at 30 or 40 an individual is declared healthy and then starts smoking, which will affect the evolution of the aorta.

If aneurysms cannot be predicted, can they be treated?

SA: In biology, extensive basic research has been conducted on the aortic system. This has allowed us to understand a lot about what causes aneurysms and how they evolve. Although specialists cannot predict an aneurysm’s appearance, they can say why the pathology appeared in a certain location instead of another, for example. For patients who already have an aneurysm, this also means that we know how to identify the risks related to the evolution of the pathology. However, no medication exists yet. Current solutions rely rather on surgery to implant a prosthesis or an endoprosthesis — a stent covered with fabric — to limit pressure on the damaged wall of the artery. Our work carried out with the Sainbiose joint research unit [run by INSERM, Mines Saint-Étienne and Université Jean Monnet], focused on gathering everything that is known so far about the aorta and aneurysms in order to propose digital models.

What is the purpose of these digital models?

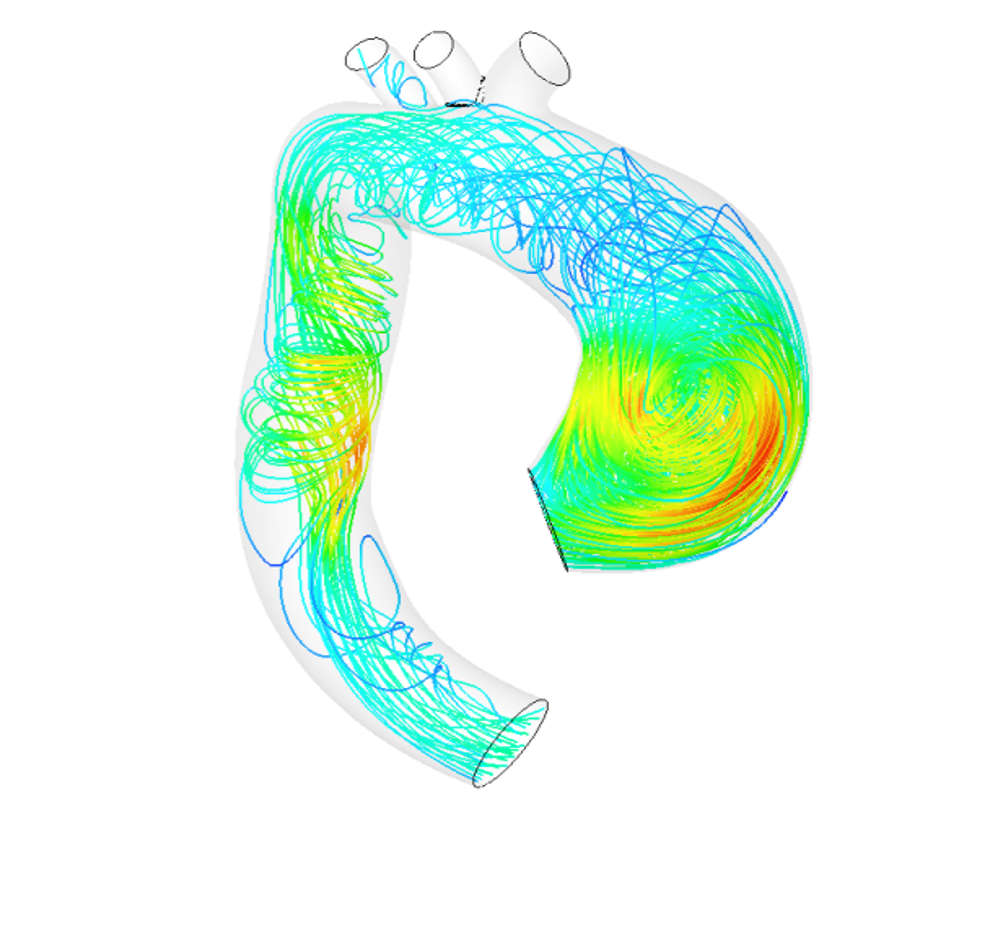
SA: The model should be seen as a 3D digital twin of the patient’s aorta. We can perform calculations on it. For example, we study how the artery evolves naturally, whether or not there is a high risk of aneurysm rupture, and if so, where exactly in the aorta. The model can also be used to analyze the effect of a prosthesis on the aneurysm. We can determine whether or not surgery will really be effective and help the surgeon choose the best type of prosthesis. This use of the model to assist with surgery led to the creation of a startup, Predisurge, in May 2017. Practitioners are already using it to predict the effect of an operation and calculate the risks.

Read on IMTech: Biomechanics serving healthcare

How do you go about building this twin of the aorta?  

SA: The first data we use comes from imaging. Patients undergo CAT scans and MRIs. The MRIs give us information about blood flow because we can have 10 to 20 photos of the same area over the duration of a cardiac cycle. This provides us with information about how the aorta compresses and expands with each heart beat. Based on this dynamic, our algorithms can trace the geometry of the aorta. By combining this data with pressure measurements, we can deduce the parameters that control the mechanical behavior of the wall, especially elasticity. We then relate this to the composition of elastin, collagen and the smooth muscle cell ratio of the wall. This gives us a very precise idea about all the parts of the patient’s aorta and its behavior.

Are the digital twins intended for all patients?

SA: That’s one of the biggest challenges. We would like to have a digital twin for each patient as this would allow us to provide personalized medicine on a large scale. This is not yet the case today. For now, we are working with groups of volunteer patients who are monitored every year as part of a clinical study run by the Saint-Étienne University hospital. Our digital models are combined with analyses by doctors, allowing us to validate these models and talk to professionals about what they would like to be able to find using the digital twin of the aorta. We know that as of today, not all patients can benefit from this tool. Analyzing the data collected, building the 3D model, setting the right biological properties for each patient… all this is too time-consuming for wide-scale implementation. At the same time, what we are trying to do is identify the groups of patients who would most benefit from this twin. Is it patients who have aneurysms caused by genetic factors? For which age groups can we have the greatest impact? We also want to move towards automation to make the tool available to more patients.

How can the digital twin tool be used on a large scale?  

SA: The idea would be to include many more patients in our validation phase to collect more data. With a large volume of data, it is easier to move towards artificial intelligence to automate processing. To do so, we have to monitor large cohorts of patients in our studies. This means we would have to shift to a platform incorporating doctors, surgeons and researchers, along with imaging device manufacturers, since this is where the data comes from. This would help create a dialogue between all the various stakeholders and show professionals how modeling the aorta can have a real impact. We already have partnerships with other IMT network schools: Télécom SudParis and Télécom Physique Strasbourg. We are working together to improve the state of the art in image processing techniques. We are now trying to include imaging professionals. In order to scale up the tool, we must also expand the scope of the project. We are striving to do just that.

Around this topic on I’MTech

MRI

Mathematical tools for analyzing the development of brain pathologies in children

Magnetic resonance imaging (MRI) enables medical doctors to obtain precise images of a patient’s structure and anatomy, and of the pathologies that may affect the patient’s brain. However, to analyze and interpret these complex images, radiologists need specific mathematical tools. While some tools exist for interpreting images of the adult brain, these tools are not directly applicable in analyzing brain images of young children and newborn or premature infants. The Franco-Brazilian project STAP, which includes Télécom ParisTech among its partners, seeks to address this need by developing mathematical modeling and MRI analysis algorithms for the youngest patients.


An adult’s brain and that of a developing newborn infant are quite different. An infant’s white matter has not yet fully myelinized and some anatomical structures are much smaller. Due to these specific features, the images obtained of a newborn infant and an adult via magnetic resonance imaging (MRI) are not the same. “There are also difficulties related to how the images are acquired, since the acquisition process must be fast. We cannot make a young child remain still for a long period of time,” adds Isabelle Bloch, a researcher in mathematical modeling and spatial reasoning at Télécom ParisTech.  The resolution is therefore reduced because the slices are thicker.”

These complex images require the use of tools to analyze and interpret them and to assist medical doctors in their diagnoses and decisions. “There are many applications for processing MRI images of adult brains. However, in pediatrics there is a real lack that must be addressed,” the researcher observes. “This is why, in the context of the STAP project, we are working to design tools for processing and interpreting images of young children, newborns and premature infants.

The STAP project, funded by the ANR and FAPESP was launched in January and will run for four years. The partners involved include the University of São Paolo in Brazil, the pediatric radiology departments at São Paolo Hospital and Bicêtre Hospital, as well as the University of Paris Dauphine and Télécom ParisTech. “Three applied mathematics and IT teams are working on this project, along with two teams of radiologists. Three teams in France, two in Brazil… The project is both international and multidisciplinary,” says Isabelle Bloch.


Rare and heterogeneous data

To work towards developing a mathematical image analysis tool, the researchers collected MRIs of young children and newborns from partner hospitals. “We did not acquire data specifically for this project,” Isabelle Bloch explains. “We use images that are already available to the doctors, for which the parents have given their informed consent for the images to be used for research purposes.” The images are all anonymized, regardless of whether they display normal or pathological anatomy. “We are very cautious: If a patient has a pathology that is so rare that his or her identity could be recognized, we do not use the image.

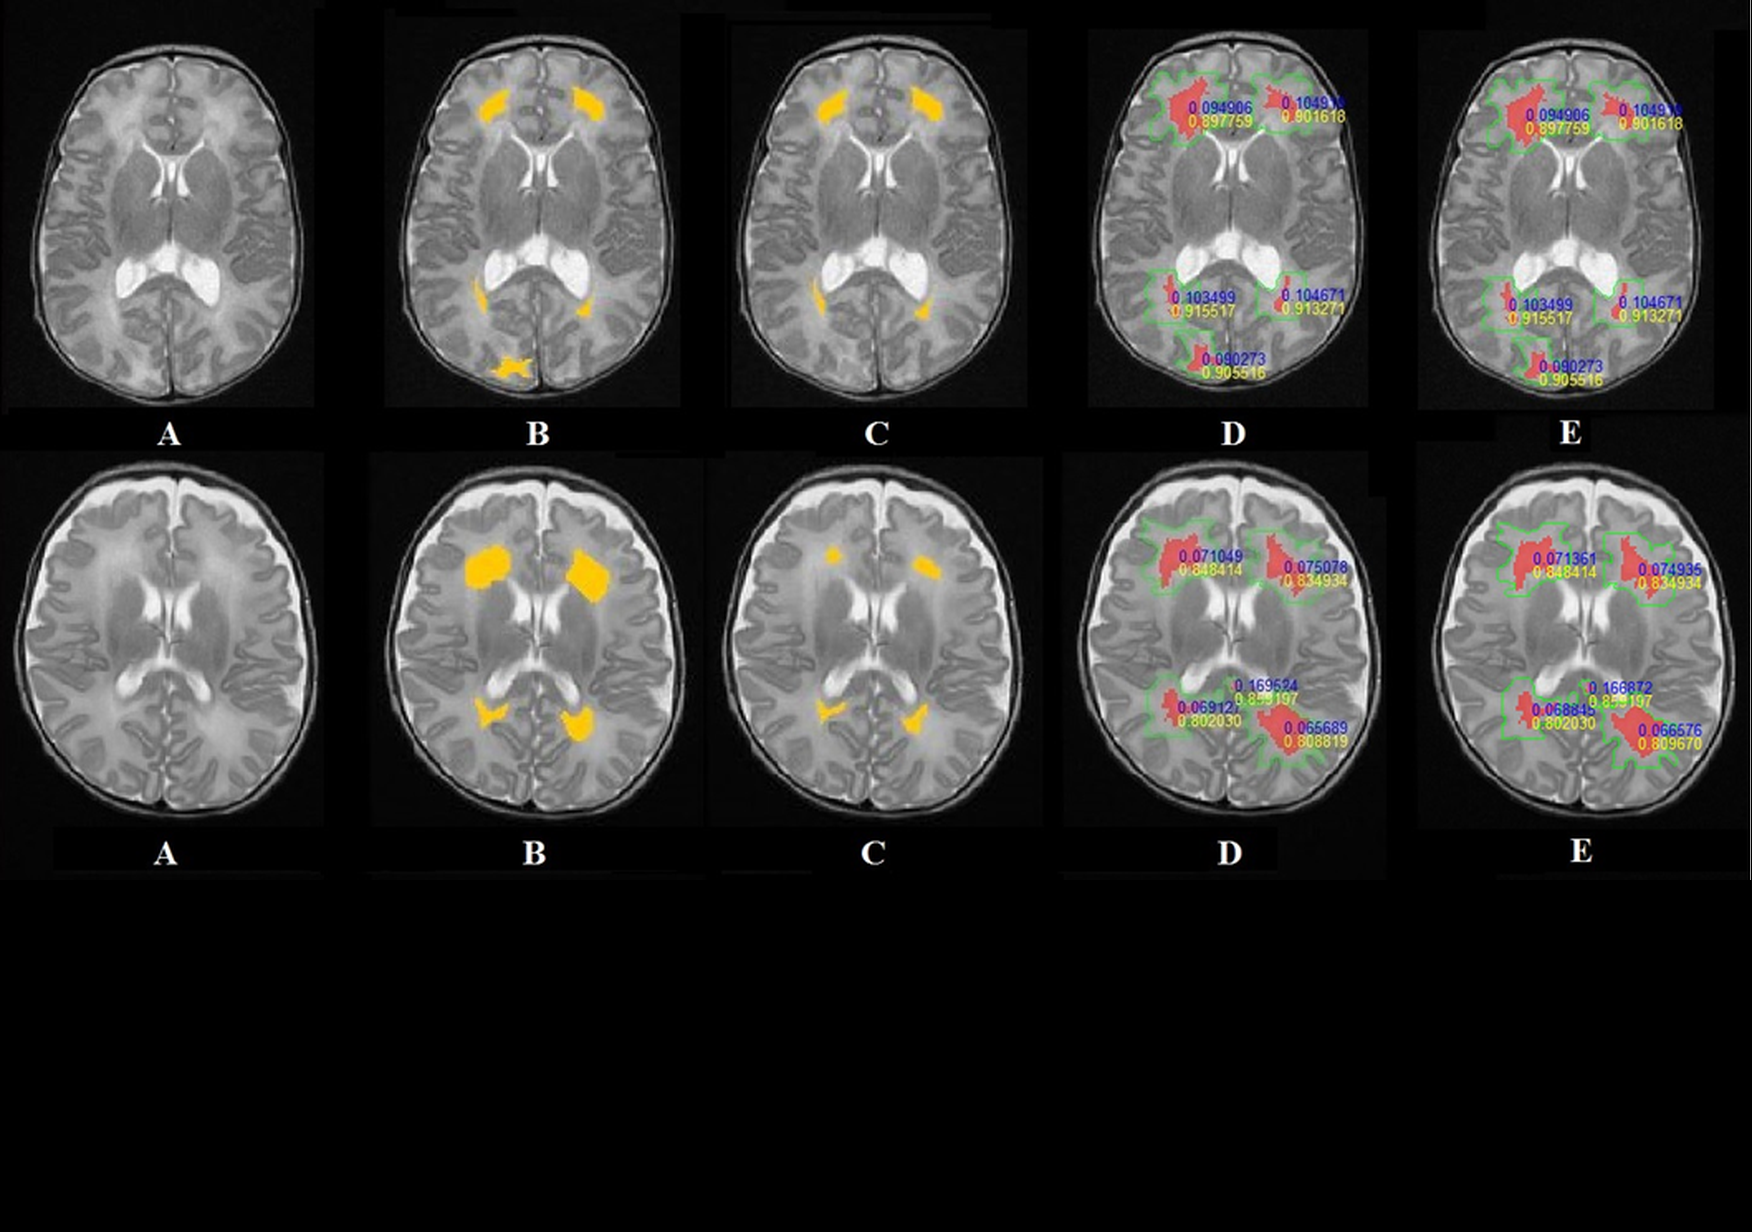
Certain pathologies and developmental abnormalities are of particular interest to researchers: hyperintense areas, which are areas of white matter that appear lighter than normal on the MRI images, developmental abnormalities in the corpus callosum, the anatomical structure which joins the two cerebral hemispheres, and cancerous tumors.

We are faced with some difficulties because few MRI images exist of premature and newborn babies,” Isabelle Bloch explains. “Finally, the images vary greatly depending on the age of the patient and the pathology. We therefore have a limited dataset and many variations that continue to change over time.


Modeling medical knowledge

Although the available images are limited and heterogeneous, the researchers can make up for this lack of data through the medical expertise of radiologists, who are in charge of annotating the MRI that are used. They will therefore have access to valuable information on brain anatomy and pathologies as well as the patient’s history. “We will work to create models in the form of medical knowledge graphs, including graphs of the structures’ spatial layout. We will have assistance from the pediatric radiologists participating in the project,” says Isabelle Bloch. “These graphs will guide the interpretation of the images and help to describe the pathology, and the surrounding structures: Where is the pathology? What healthy structures could it affect? How is it developing?

For this model, each anatomical structure will be represented by a node. These nodes are connected by edges that bear attributes such as spatial relationships or contrasts of intensity that exist in the MRI.  This graph will take into account the patient’s pathologies by adapting and modifying the links between the different anatomical structures. “For example, if the knowledge shows that a given structure is located to the right of another, we would try to obtain a mathematical model that tells us what ‘to the right of’ means,” the researcher explains. “This model will then be integrated into an algorithm for interpreting images, recognizing structures and characterizing a disease’s development.”

After analyzing a patient’s images, the graph will become an individual model that corresponds to a specific patient. “We do not yet have enough data to establish a standard model, which would take variability into account,” the researcher adds. “It would be a good idea to apply this method to groups of patients, but that would be a much longer-term project.


An algorithm to describe images in the medical doctor’s language

In addition to describing the brain structures spatially and visually, the graph will take into account how the pathology develops over time. “Some patients are monitored regularly. The goal would be to compare MRI images spanning several months of monitoring and precisely describe the developments of brain pathologies in quantitative terms, as well as their possible impact on the normal structures,” Isabelle Bloch explains.

Finally, the researchers would like to develop an algorithm that would provide a linguistic description of the images’ content using the pediatric radiologist’s specific vocabulary. This tool would therefore connect the quantified digital information extracted from images with words and sentences. “This is the reverse method of that which is used for the mathematical modeling of medical knowledge,” Isabelle Bloch explains. “The algorithm would therefore describe the situation in a quantitative and qualitative manner, hence facilitating the interpretation by the medical expert.

In terms of the structural modeling, we know where we are headed, although we still have work to do on extracting the characteristics from the MRI,” says Isabelle Bloch regarding the project’s technical aspects. “But combining spatial analysis with temporal analysis poses a new problem… As does translating the algorithm into the doctor’s language, which requires transitioning from quantitative measurements to a linguistic description.” Far from trivial, this technical advance could eventually allow radiologists to use new image analysis tools better suited to their needs.

Find out more about Isabelle Bloch’s research

gender diversity, digital professions

Why women have become invisible in IT professions

Female students have deserted computer science schools and women seem mostly absent from companies in this sector. The culprit: the common preconception that female computer engineers are naturally less competent than their male counterparts.  The MOOC entitled Gender Diversity in IT Professions*, launched on 8 March 2018, looks at how sexist stereotypes are constructed, often insidiously. Why are women now the minority, rendered invisible in the digital sector despite the many female pioneers and entrepreneurs have paved the way for the development of software and video games?  Chantal Morley, a researcher within the Gender@Telecom group at Institut Mines-Telecom Business School, takes a look back at the creation of this MOOC, highlighting the research underpinning the course.


In 2016, only 33% of digital jobs were occupied by women (OPIIEC). Taking into account only the “core” professions in the sector (engineer, technician or project manager), the percentage falls to 20%. Why is there such a gender gap? No, it’s not because women are less talented in technical professions, nor because they prefer other areas. The choices made by young women in their training and women in their careers is not always the result of a free and informed decision. The influence of stereotypes plays a significant role. These popular beliefs reinforce the idea that the IT field is inherently masculine, a place where women do not belong, and this influences our choices and behaviors even when we do not realize it.

The research group Gender@Telecom, which brings together several female researchers from IMT schools, is looking at the issue of women’s role in the field of information and communication technologies, and specifically the software sector. Through their studies and analysis, the group’s researchers have observed and described how these stereotypes are expressed.  “We interviewed professionals in the sector, and asked students specific questions about their choices and opinions,” explains Chantal Morley, researcher at Institut Mines-Telecom Business School. By analyzing the speech from those interviews, the researchers identified many preconceived notions. “Women do not like computer science, it does not interest them, for example,” the researcher continues. “These representations are unproven and do not match reality!” These little phrases that communicate stereotypes are heard from both men and women. “One might think that this type of differentiation in representations would not exist among male and female students, but that is not the case,” says Chantal Morley. “During a study conducted in Switzerland, we found that guidance counselors are also very much influenced by these stereotypes.” Among professionals, these views are even cited as arguments justifying certain choices.


Little phrases, big impacts

The Gender Diversity in IT Professions MOOC* developed by the Gender@Telecom group is aimed at deconstructing these stereotypes. “We used these studies to try to show learners how little things in everyday life, which we do not even notice, contribute to instilling these differentiated views,” Chantal Morley explains. These little phrases or representations can also be found in our speech as well as in advertisements, posters… When viewed individually, these small occurrences are insignificant, yet it is their repetition and systematic nature that pose a problem. Together they work to establish and reinforce sexist stereotypes. “They form a common knowledge, a popular belief that everyone is aware of, that we all accept, saying ‘that’s just the way it is!’”

To study this phenomenon, the researchers from the group analyzed speech from semi-structured interviews conducted with stakeholders in the digital industry. The researchers’ questions focused on the relationship with technology and an entrepreneurship competition that had recently been held at Institut Mines-Telecom Business School. “Again, in this study, some types of arguments were frequently repeated and helped reinforce these stereotypes,” Chantal Morley observes. “For example, when someone mentions a woman who is especially talented, the person will often add, ‘yes, but with her it’s different, that doesn’t count.’ There is always an excuse for not questioning the general rule that says women lack the abilities required in digital professions.


Unjustified stereotypes

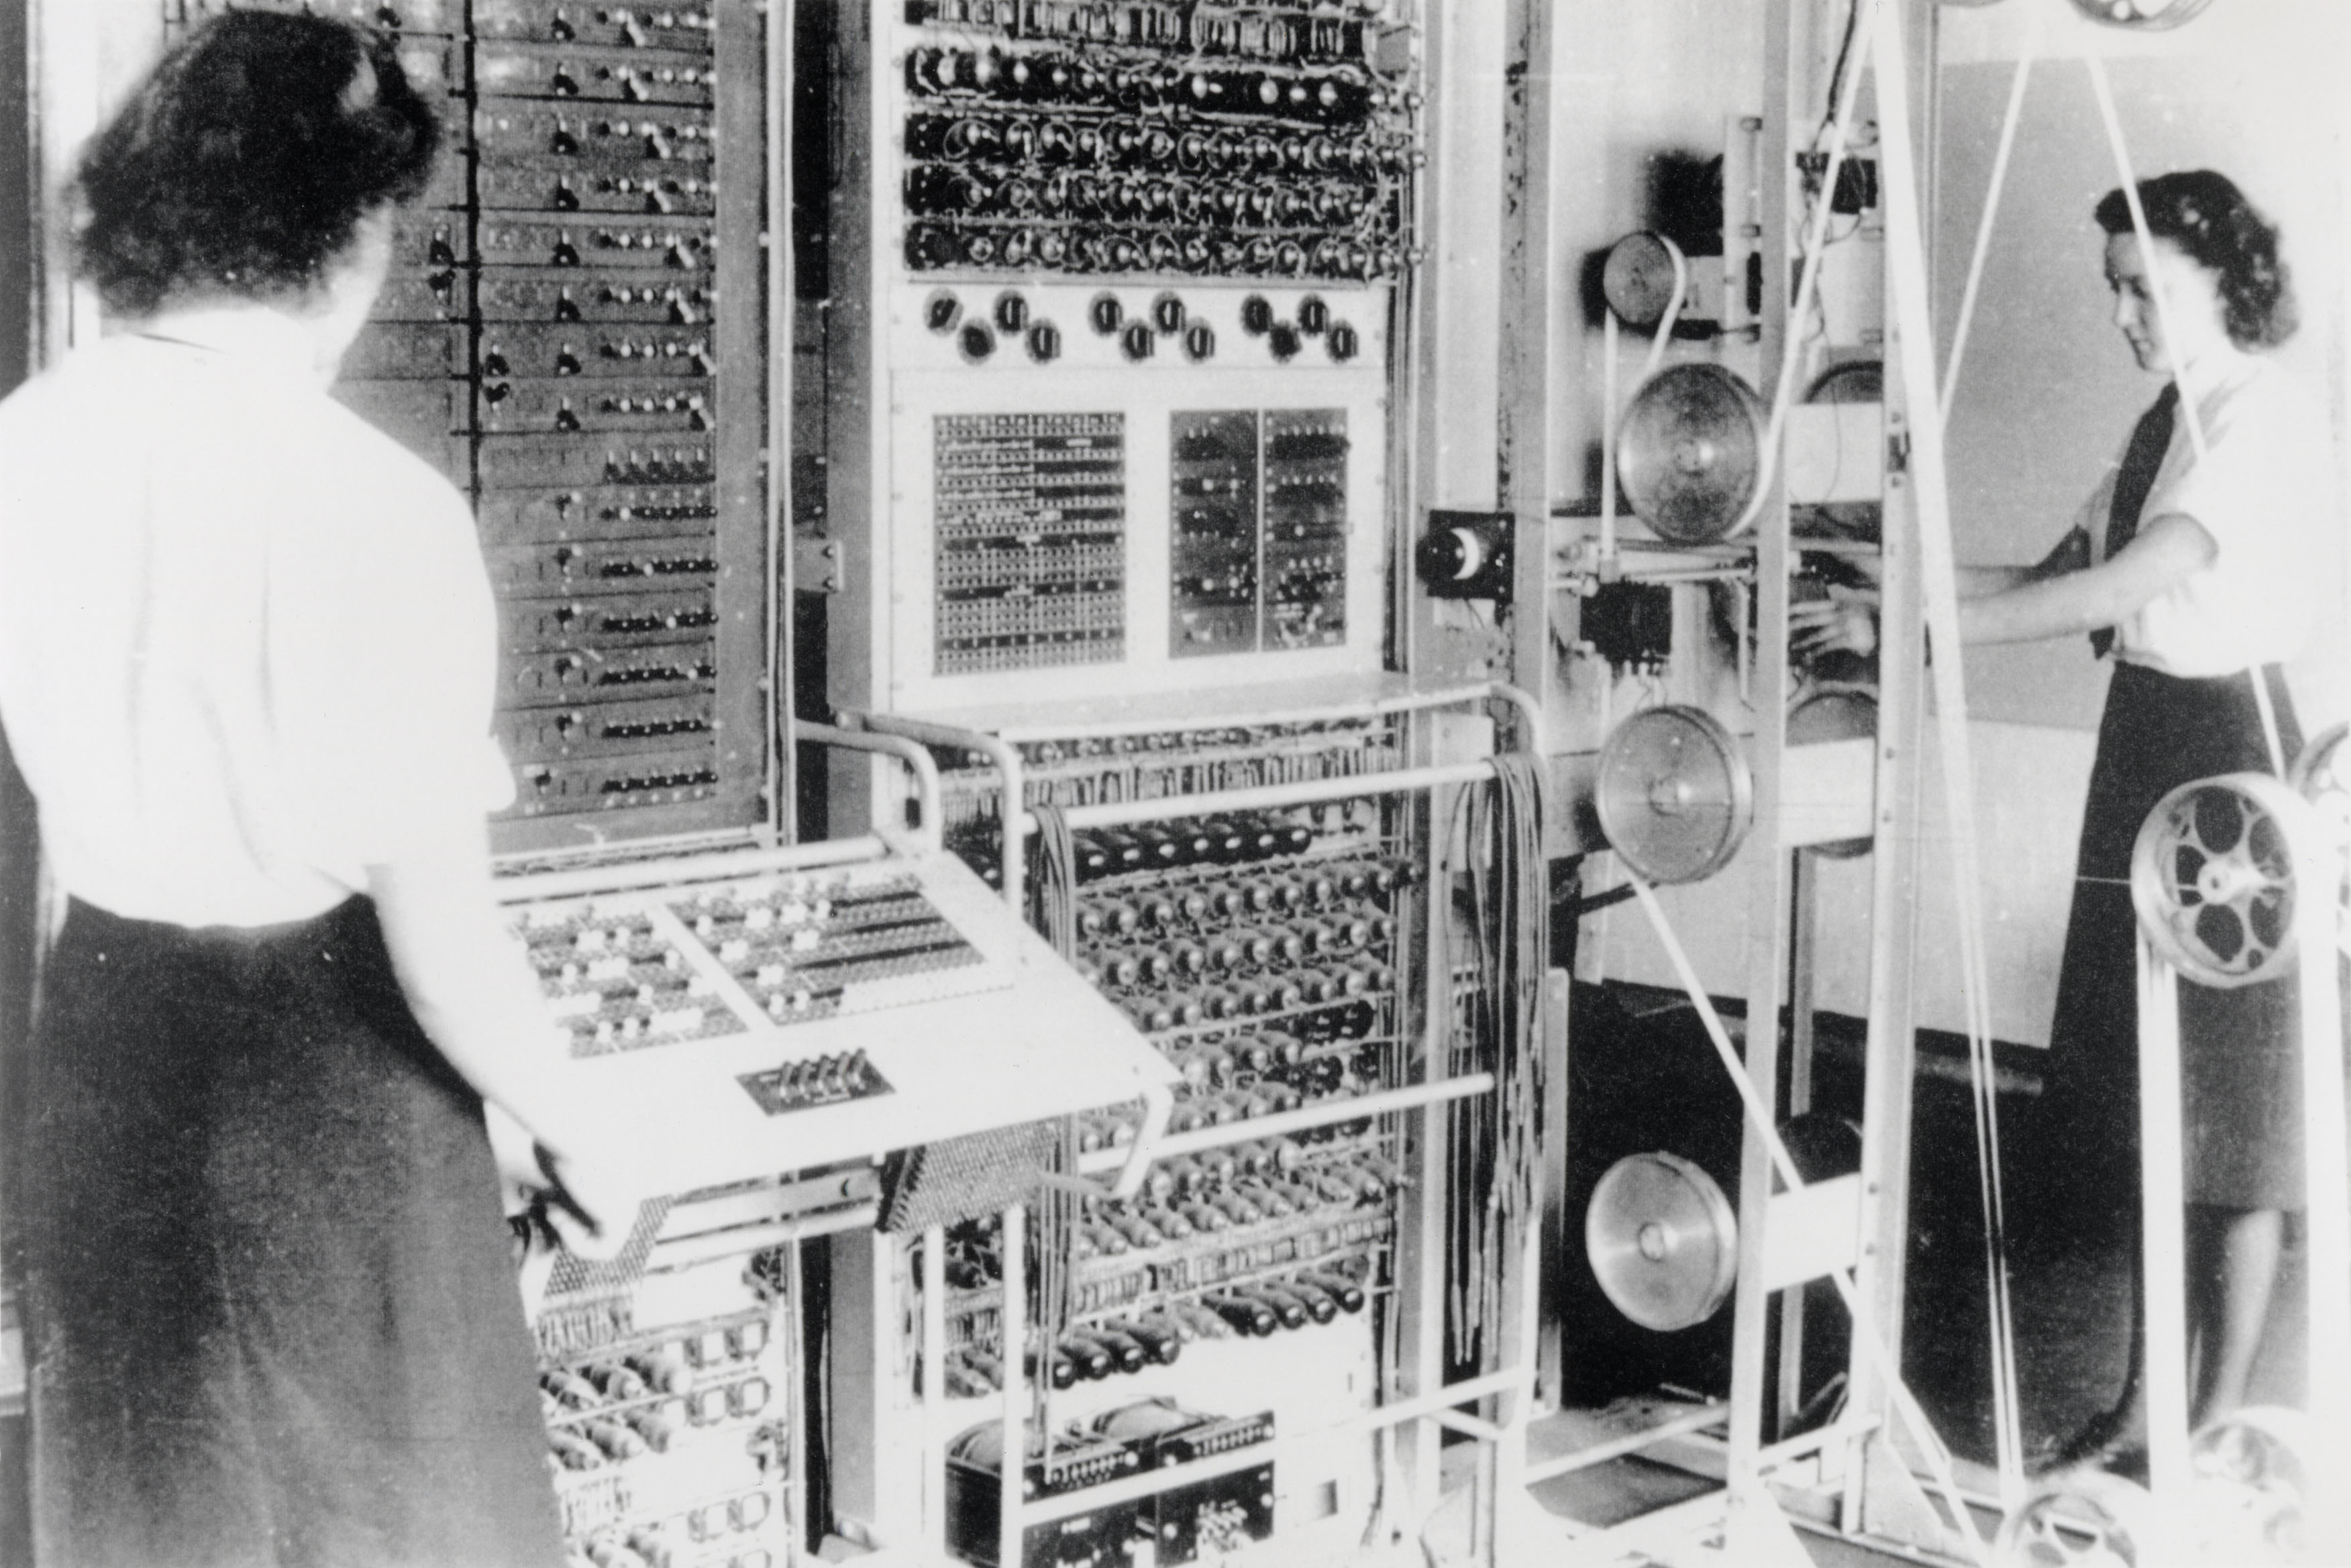
Yet despite their pervasiveness, there is nothing to justify these remarks. The history of computer science professions proves this fact. However, the contribution of women has long been hidden behind the scenes. “When we studied the history of computer science, we were primarily looking at the area of hardware, equipment. Women were systematically rejected by universities and schools in this field, where they were not allowed to earn a diploma,” says Chantal Morley. “Also, some companies refused to keep their employees if they had a child or got married. This made careers very difficult.” In recent years, research on the history of the software industry, in which there were more opportunities, has revealed that many women contributed to major aspects of its development.

Ada Lovelace is sort of the Marie Curie of computer science… People think she is the only one! Yet she is one contributor among others,” the researcher explains. For example, the computer scientist Grace Hopper invented the first compiler and the COBOL language in the 1950s. “She had the idea of inventing a translator that would translate a relatively understandable and accessible language into machine language. Her contribution to programming was crucial,” Chantal Morley continues. “We can also mention Roberta Williams, a computer scientist who greatly contributed to the beginnings of video games, or Stephanie Shirley, a pioneer computer scientist and entrepreneur…”

In the past these women were able to fight for their place in software professions. What has happened to make women seem absent from these arenas? According to Chantal Morley, the exclusion of women occurred with the arrival of microcomputing, which at the time had been designed for a primarily male target, that of executives. “The representations conveyed at that time progressively led everyone to associate working with computers with men.” But although women are a minority in this sector, they are not completely absent. “Many have participated in the creation of very large companies, they found startups, and there are some very famous women hackers,” Chantal Morley observes. “But they are not at all in the spotlight and do not get much press coverage. As if they were an anomaly, something unusual…

Finally, women’s role in the digital industry varies greatly depending on the country and culture. In India and Malaysia, for example, computer science is a “women’s” profession. It is all a matter of perspective, not a question of innate abilities.


[box type=”shadow” align=”” class=”” width=””]*A MOOC combating sexist stereotypes

How are these stereotypes constructed and maintained? How can they be deconstructed? How can we promote the integration of women in digital professions? The Gender Diversity in IT Professions MOOC (in French), launched on 8 March 2018, uncovers the little-known contribution of women to the development of the software industry and what mechanisms cause them to remain hidden and discouraged from integrating this sector. The MOOC is aimed at raising awareness among companies, schools and research organizations on these issues to provide them with keys for developing a more inclusive culture for women. [/box]

Also read on I’MTech


AI, an issue of economy and civilization?

This is the first issue of the new quarterly of the series Annales des Mines devoted to the digital transition. The progress made using algorithms, the new computational capacities of devices (ranging from graphic cards to the cloud), and the availability of huge quantities of data combine to explain the advances under way in Artificial Intelligence. But AI is not just a matter of algorithms operating in the background on digital platforms. It increasingly enters into a chain of interactions with the physical world. The examples reported herein come from finance, insurance, employment, commerce and manufacturing. This issue turns to the stakeholders, in particular French, who are implementing AI or who have devoted thought to this implementation and to AI’s place in our society.

Introduction by Jacques Serris, Engineer from the Corps des Mines, Conseil Général de l’Économie (CGE)

About Digital issues, the new series of Annales des Mines

Digital Issues is a quarterly series (March, June, September and December) freely downloadable on the Annales des Mines website, with a print version in French language. Focus of the series is on the issues of the digital transition for an enlightened, yet non necessarily expert, readership. Various viewpoints are being used between technology, economy and society as the Annales des Mines are used to doing in all their series.

Download all the articles of the issue